
Good Sunday Afternoon,
Check out the latest pattern outlook below.
Note: I’m using 12z Model run today for this update. Also, it will be based on Zulu time.
Click on this great blog site for a variety of weather discussions.
| Climate Trends Provided by HPRCC |
||
 |
 |
|
| 2024 Temperature Anomalies | 2024 Precipitation Total Anomalies | |
 |
 |
|
| October Temperature Anomalies | October Precipitation Anomalies | |
| 1 to 5 Day Model Ensemble Trend |
||
| Sunday, October 29th through Friday, October 18th |
||
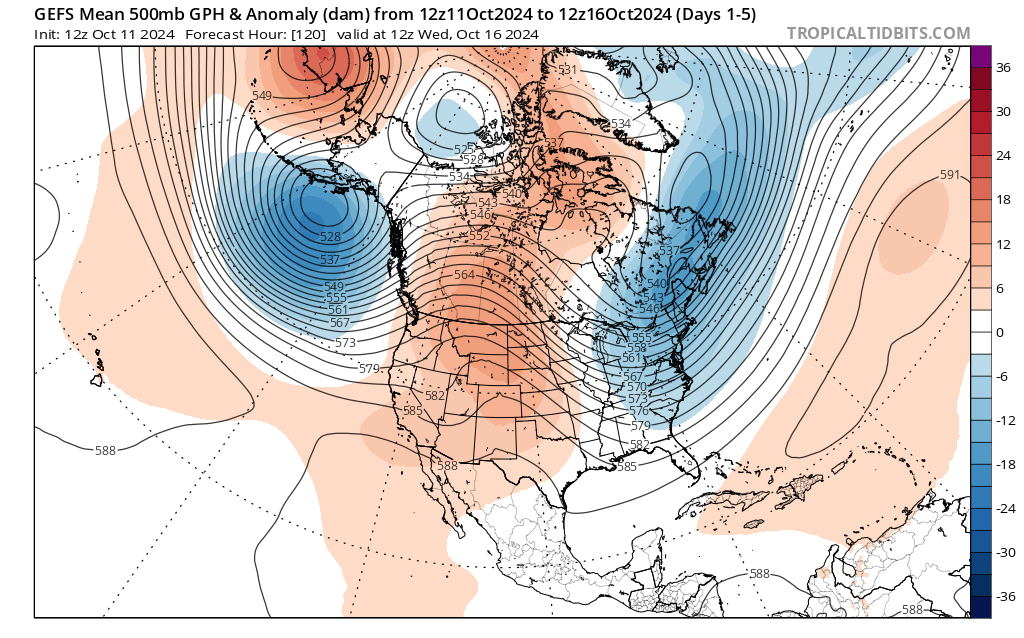
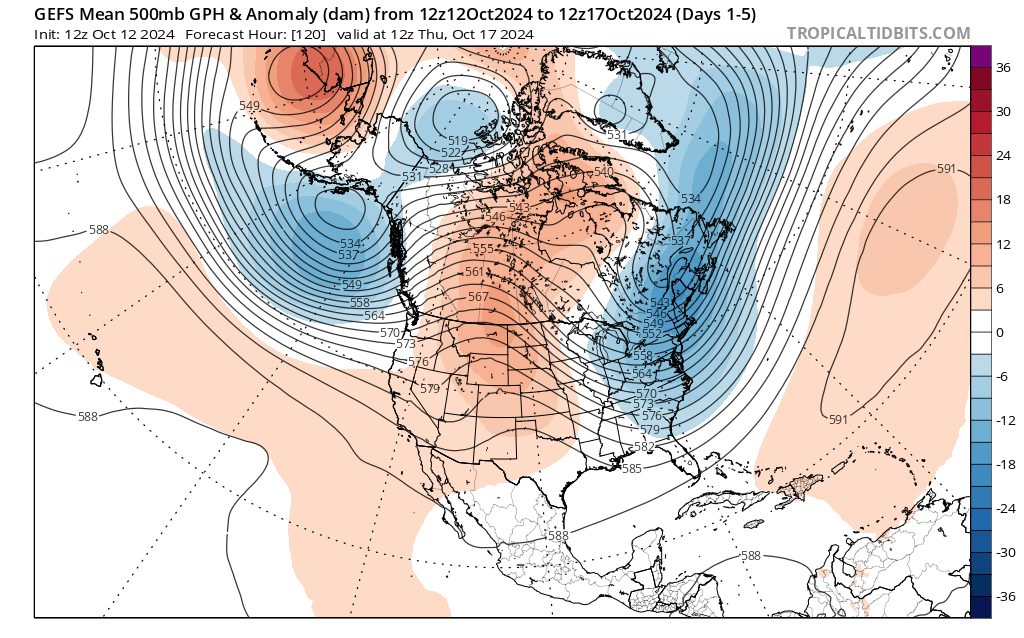
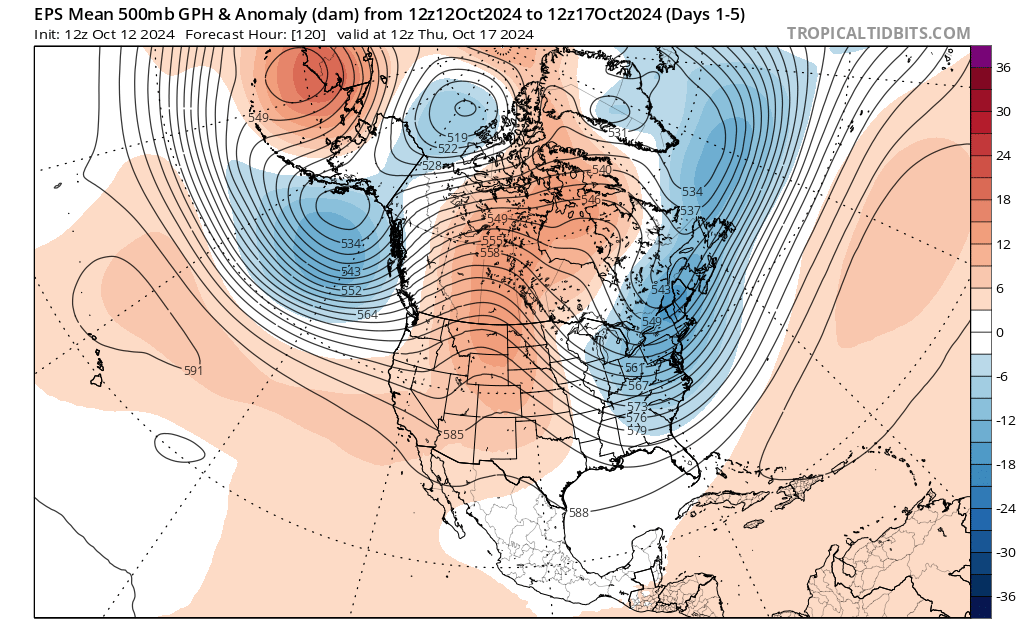
| 500mb Anomaly Plots | ||
 |
 |
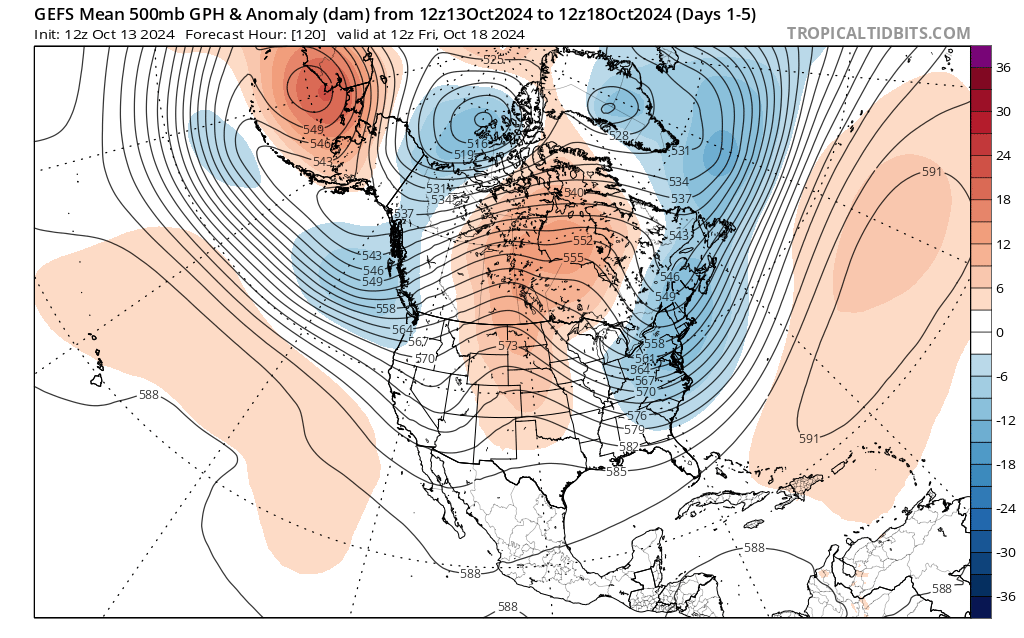 |
| GEFS – 12z Fri, October 11th | GEFS – 12z Sat, October 12th | GEFS – 12z Sun, October 13th |
 |
 |
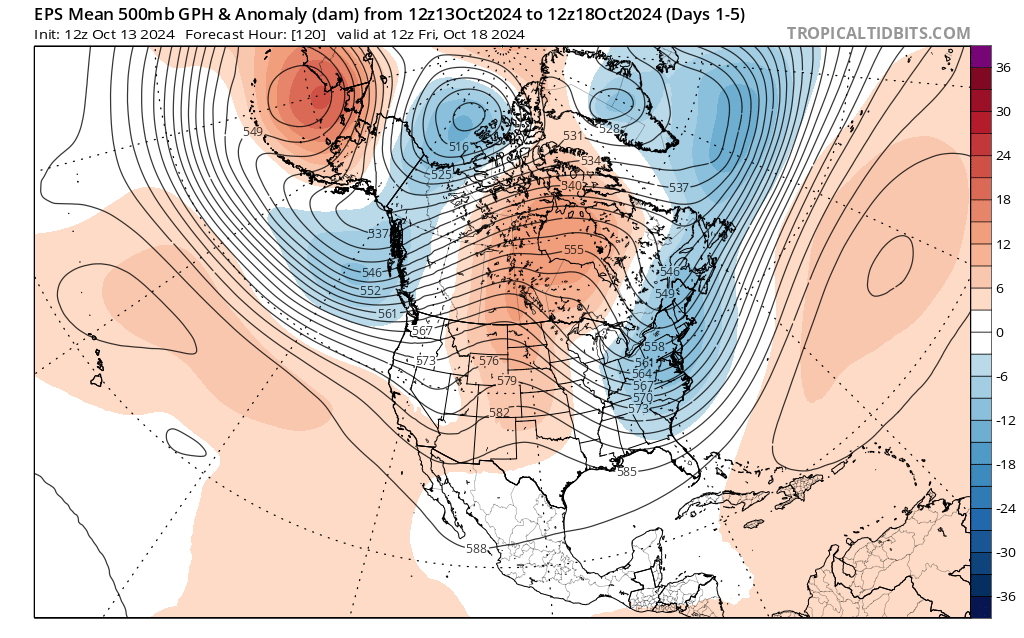 |
| EPS – 12z Fri, October 11th | EPS – 12z Sat, October 12th | EPS – 12z Sun, October 13th |
|
|
||
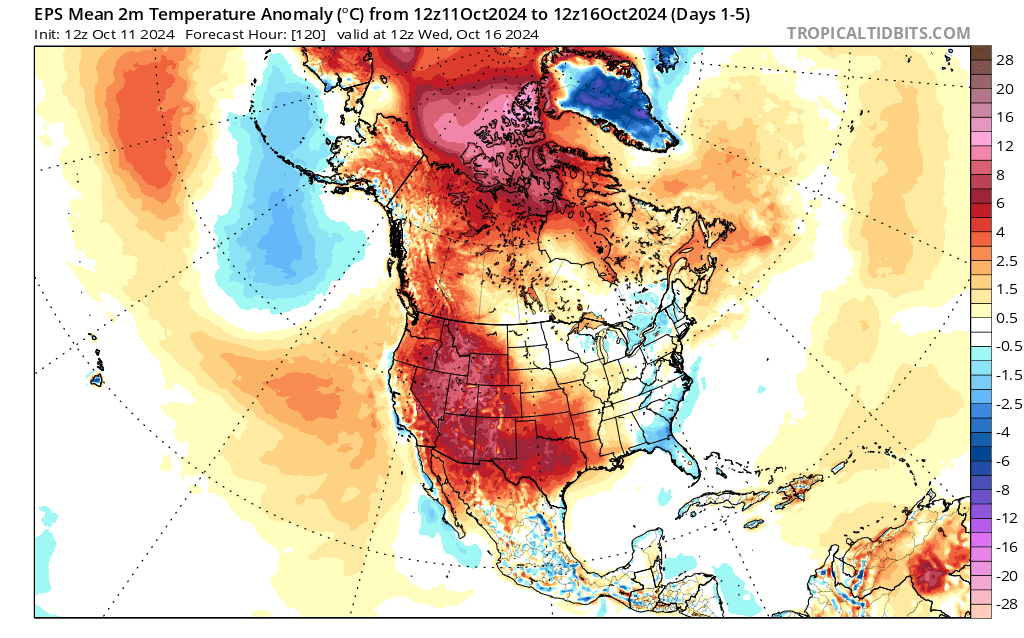
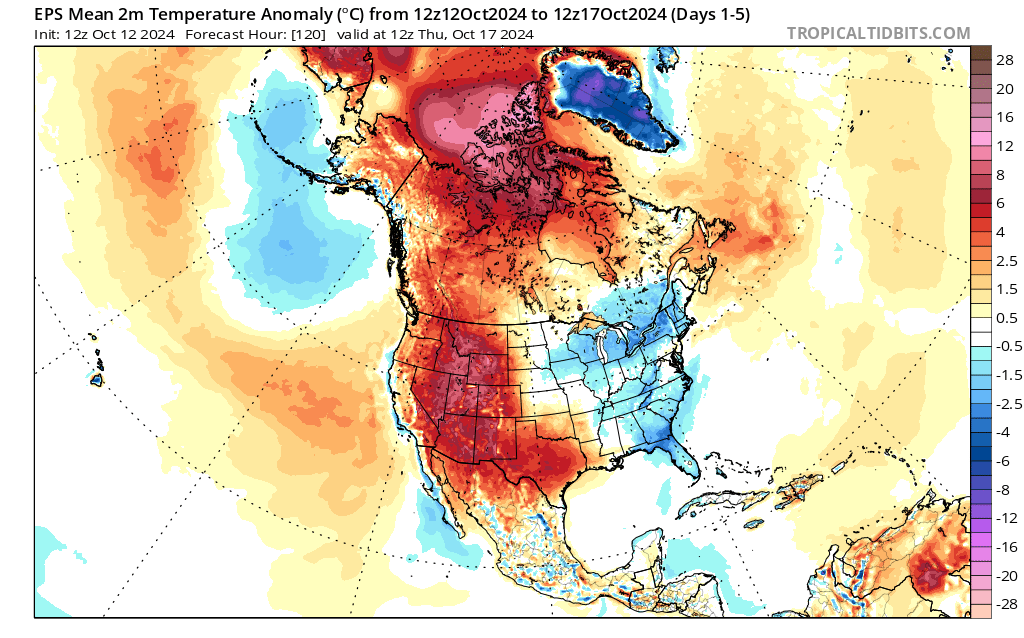
| 1 to 5 Day Model Ensemble Trend | ||
| Sunday, October 29th through Friday, October 18th | ||
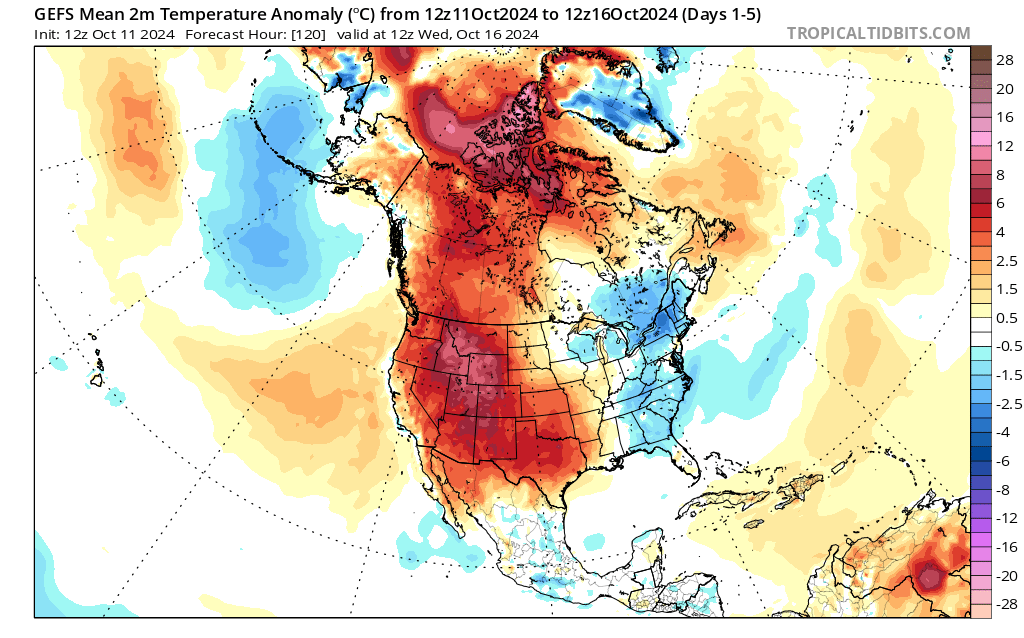
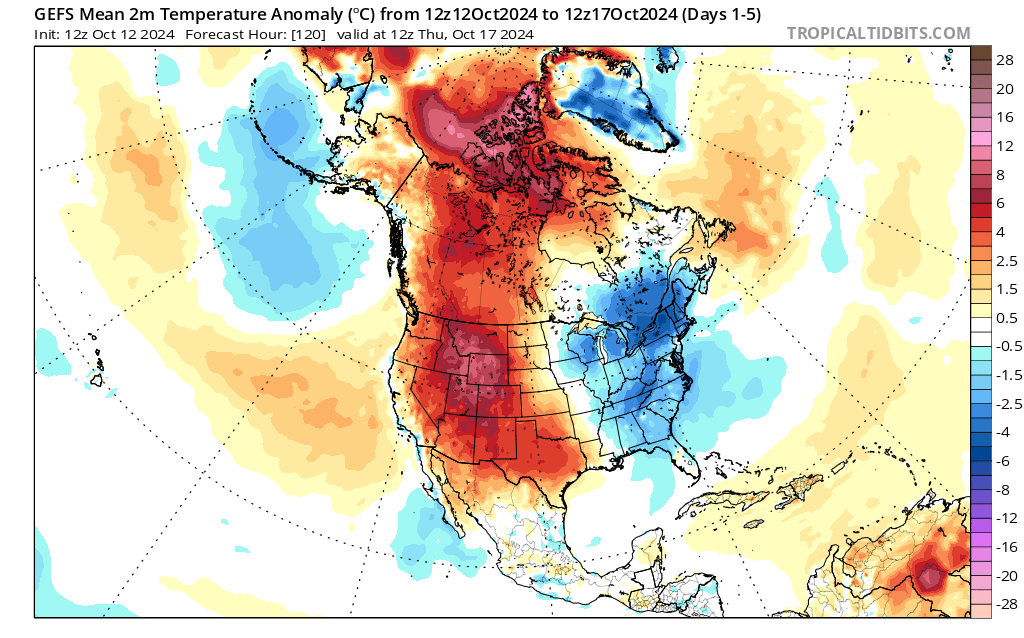
| Surface Temperature Anomaly Plots | ||
 |
 |
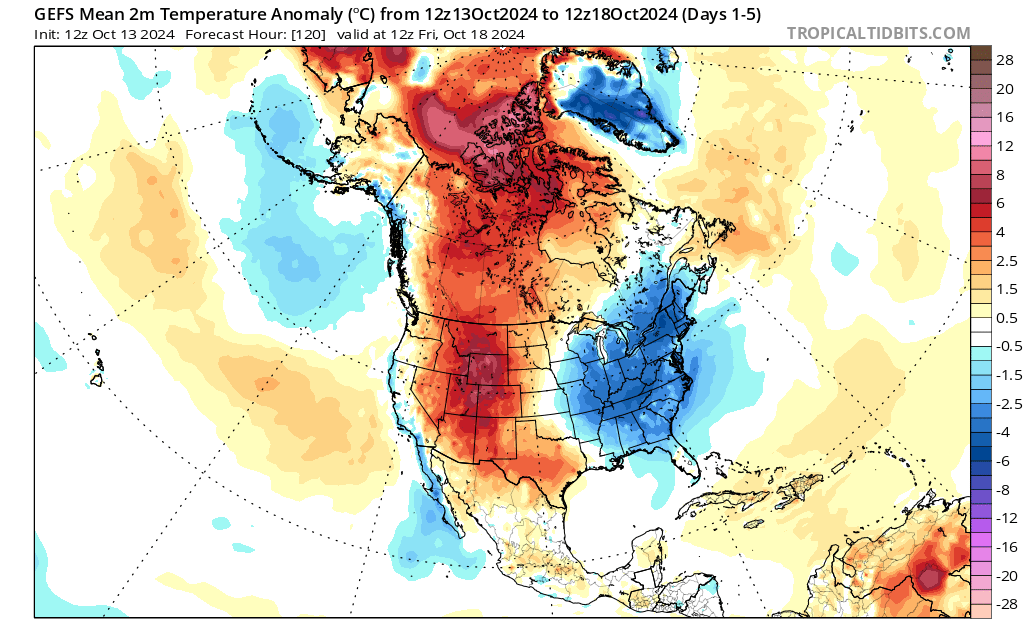 |
| GEFS – 12z Fri, October 11th | GEFS – 12z Sat, October 12th | GEFS – 12z Sun, October 13th |
 |
 |
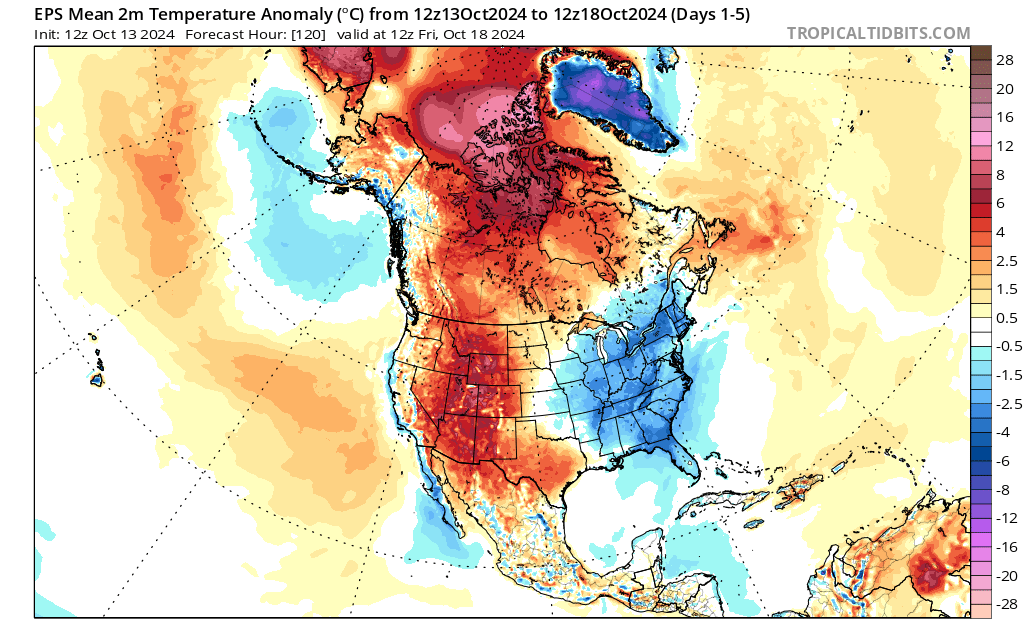 |
| EPS – 12z Fri, October 11th | EPS – 12z Sat, October 12th | EPS – 12z Sun, October 13th |
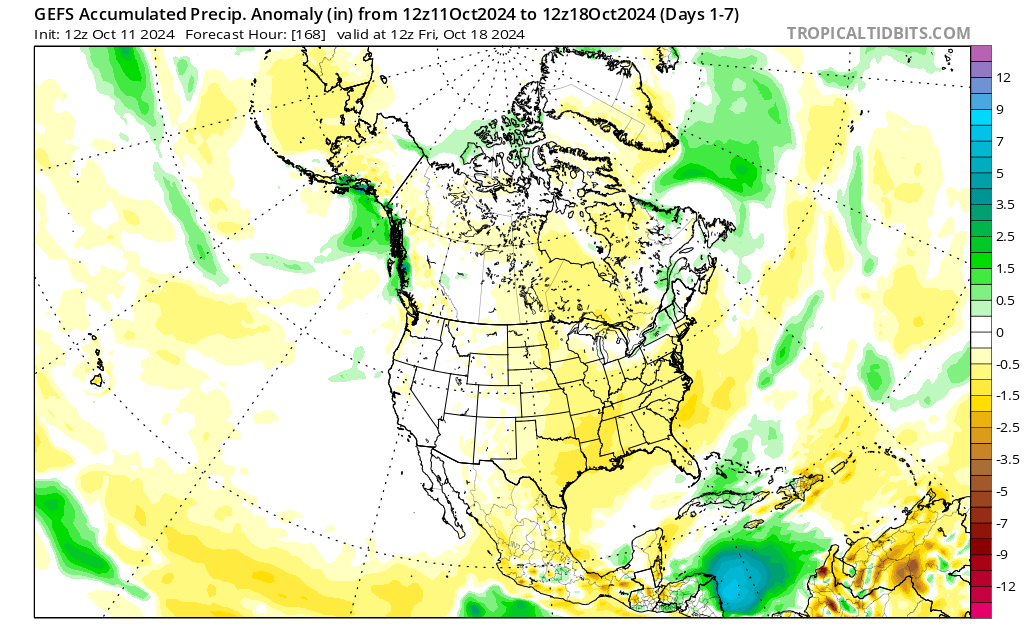
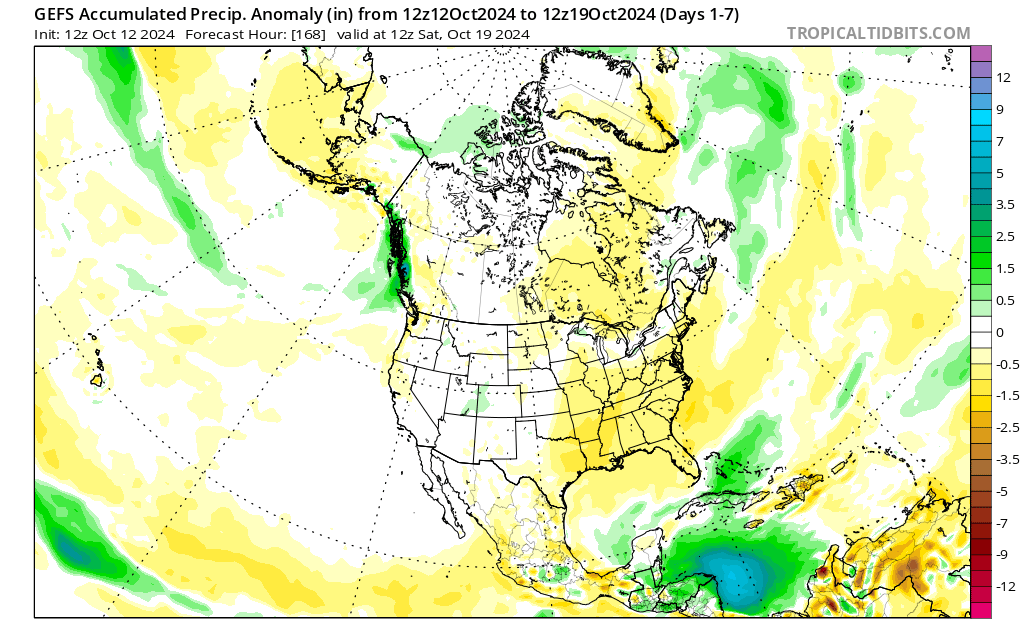
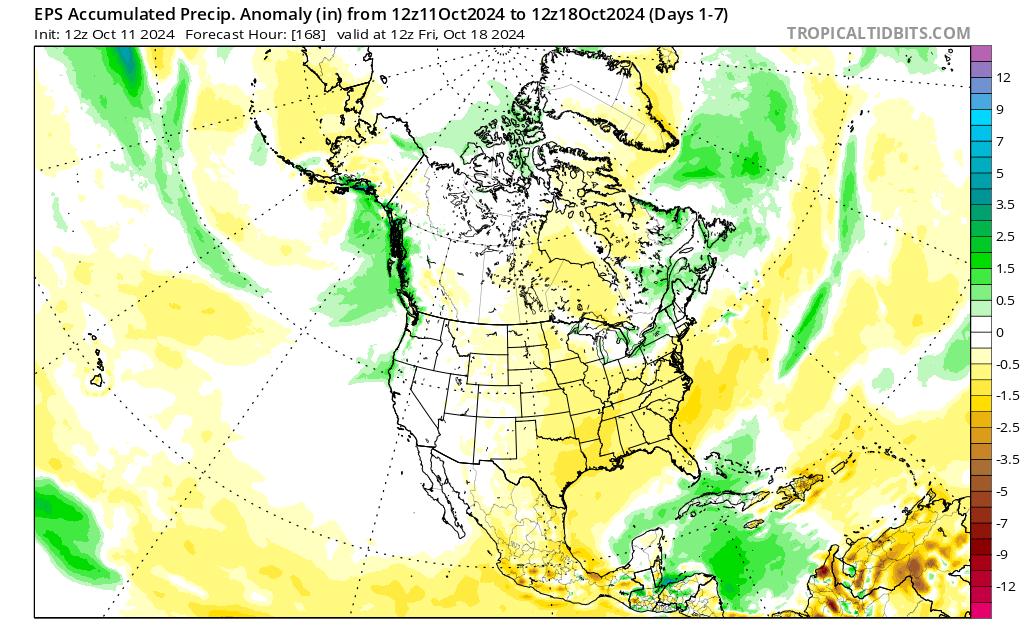
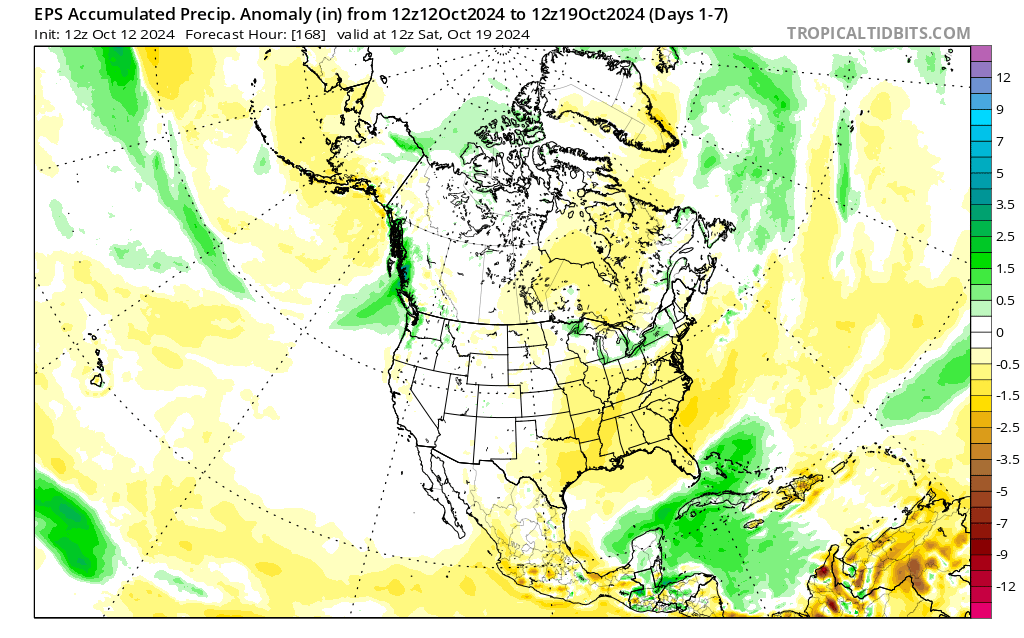
| 1 to 7 Day Model Ensemble Trend | ||
| Sunday, October 13th through Sunday, October 20th | ||
| Precipitation Anomaly Plots | ||
 |
 |
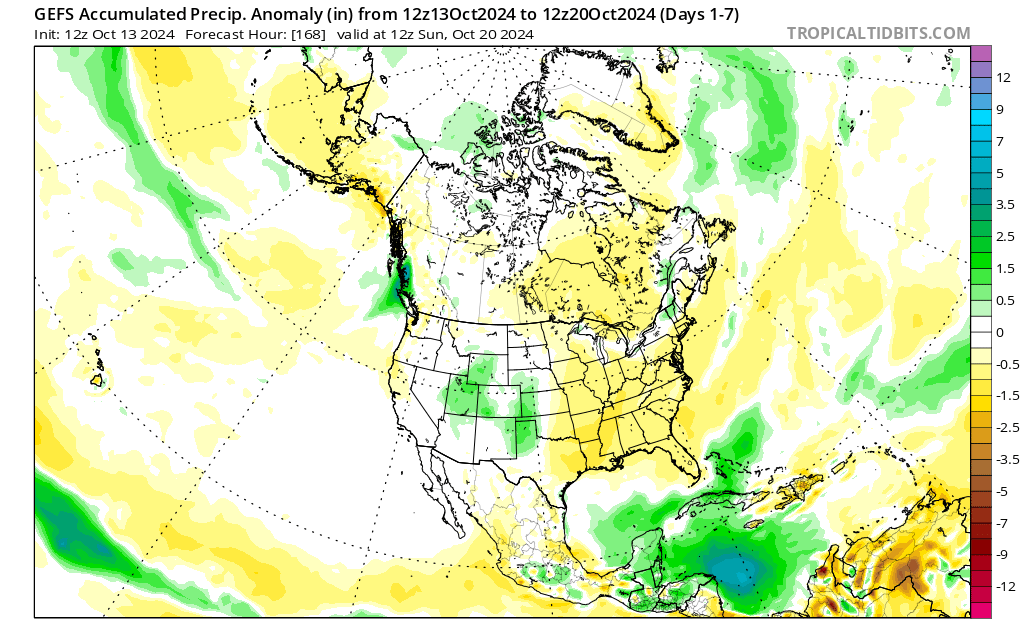 |
| GEFS – 12z Fri, October 11th | GEFS – 12z Sat, October 12th | GEFS – 12z Sun, October 13th |
 |
 |
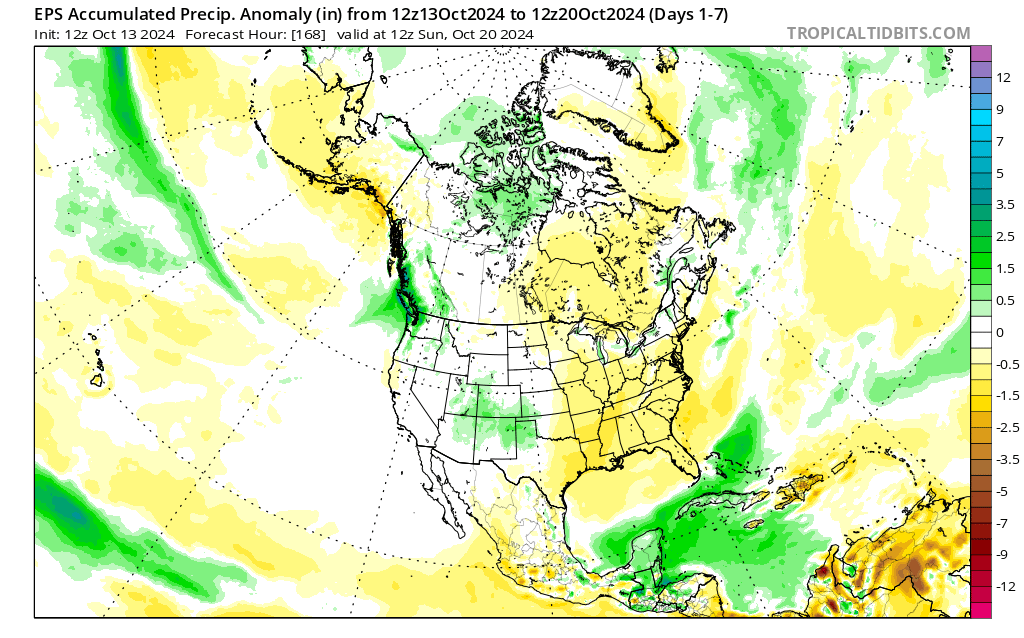 |
| EPS – 12z Fri, October 11th | EPS – 12z Sat, October 12th | EPS – 12z Sun, October 13th |
| CIPS Analog Historical Guidance – Short Range Guidance (36 to 120 Hours) |
||
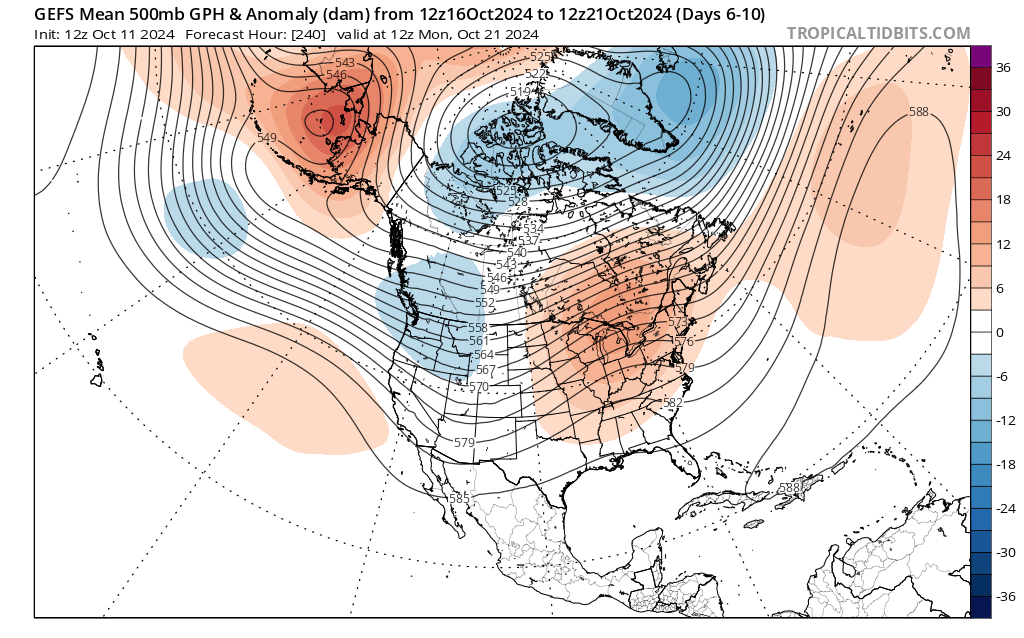
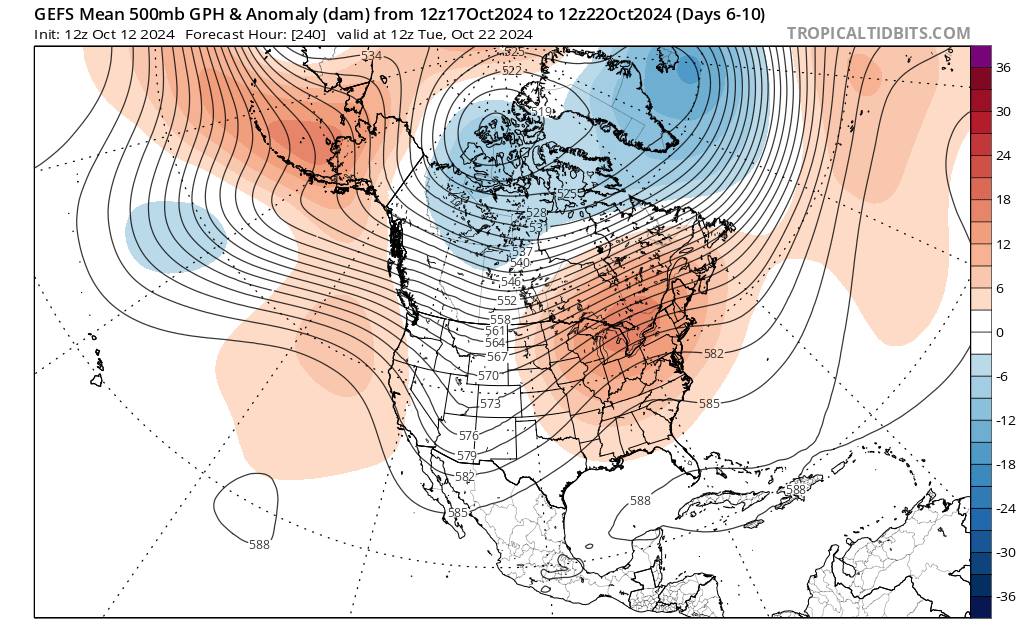
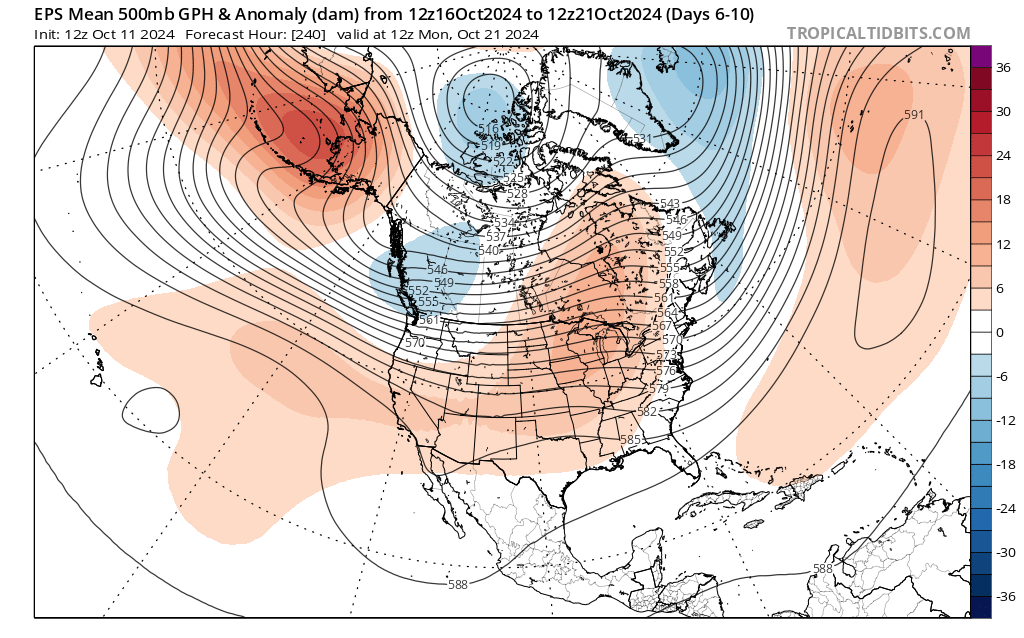
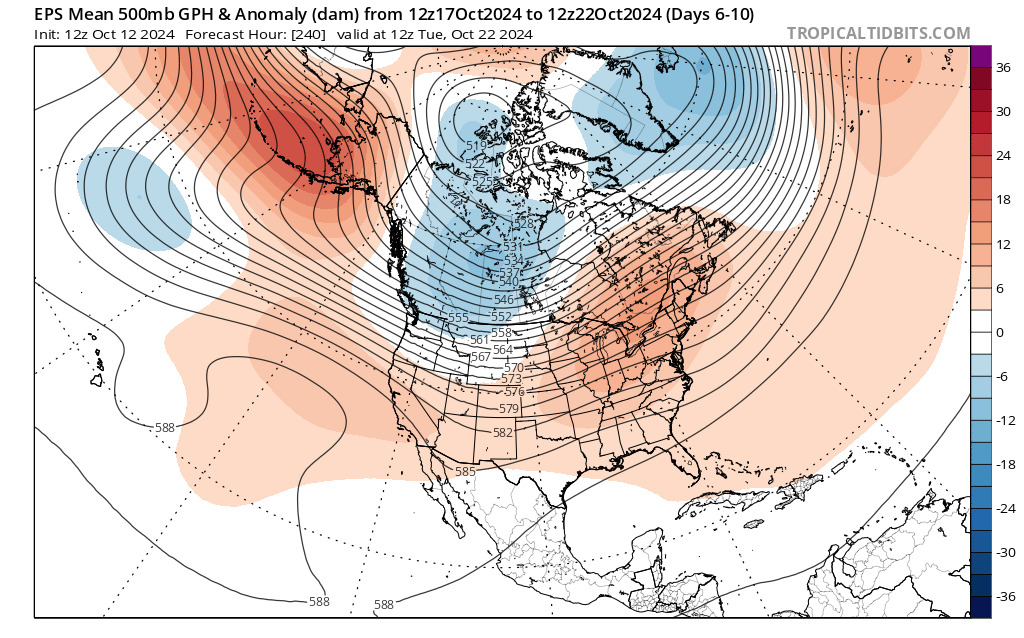
| 6 to 10 Day Model Ensemble Trend |
||
| Friday, October 18th through Wednesday, October 23rd | ||
| 500mb Height Anomaly Plots | ||
 |
 |
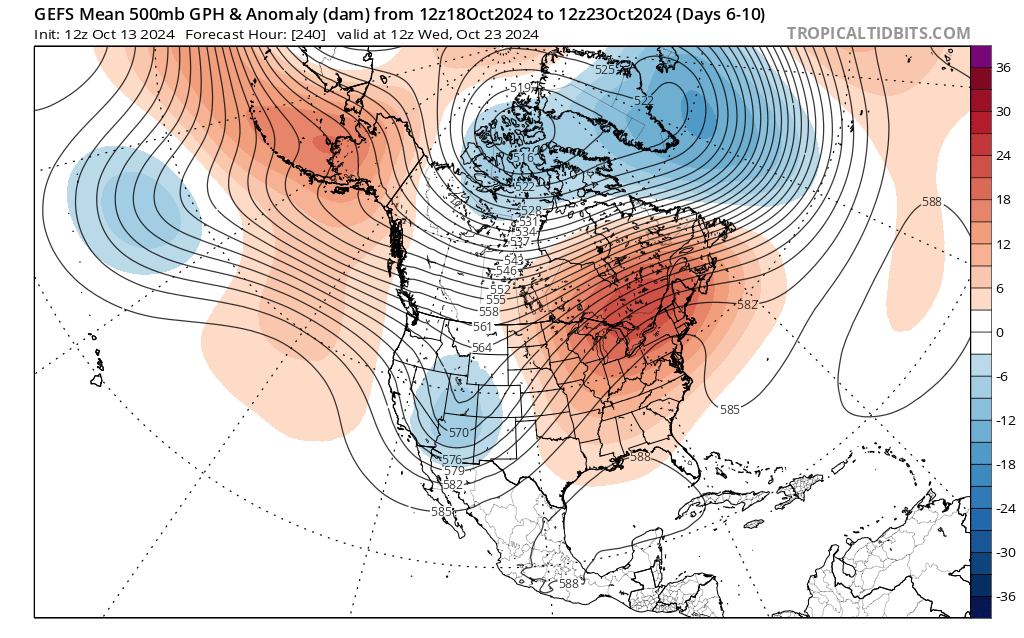 |
| GEFS -12z Fri, October 11th | GEFS – 12z Sat, October 12th | GEFS – 12z Sun, October 13th |
 |
 |
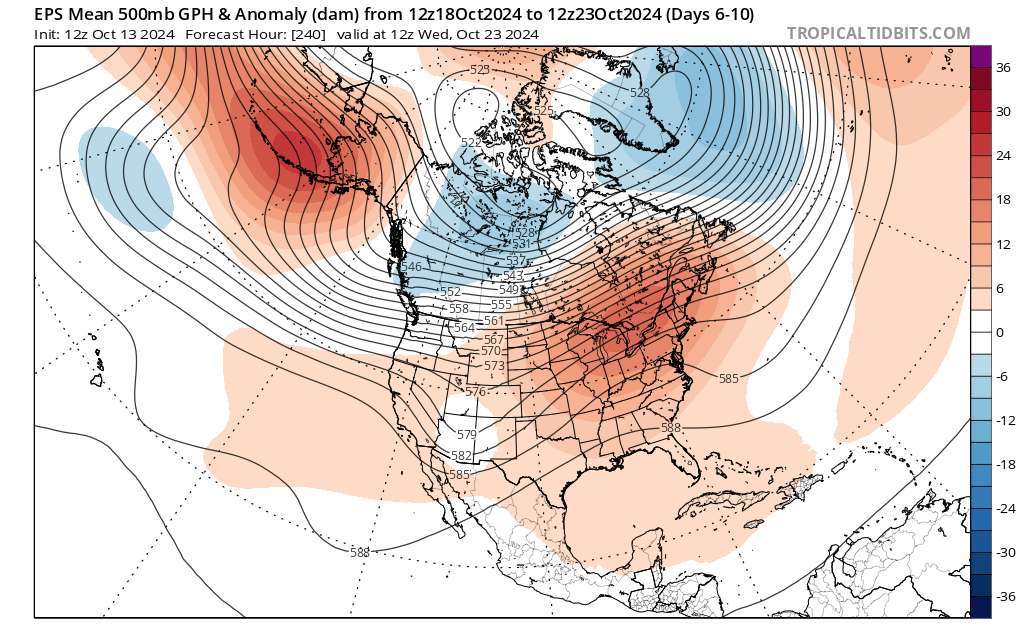 |
| EPS – 12z Fri, October 11th | EPS – 12z Sat, October 12th | EPS – 12z Sun, October 13th |
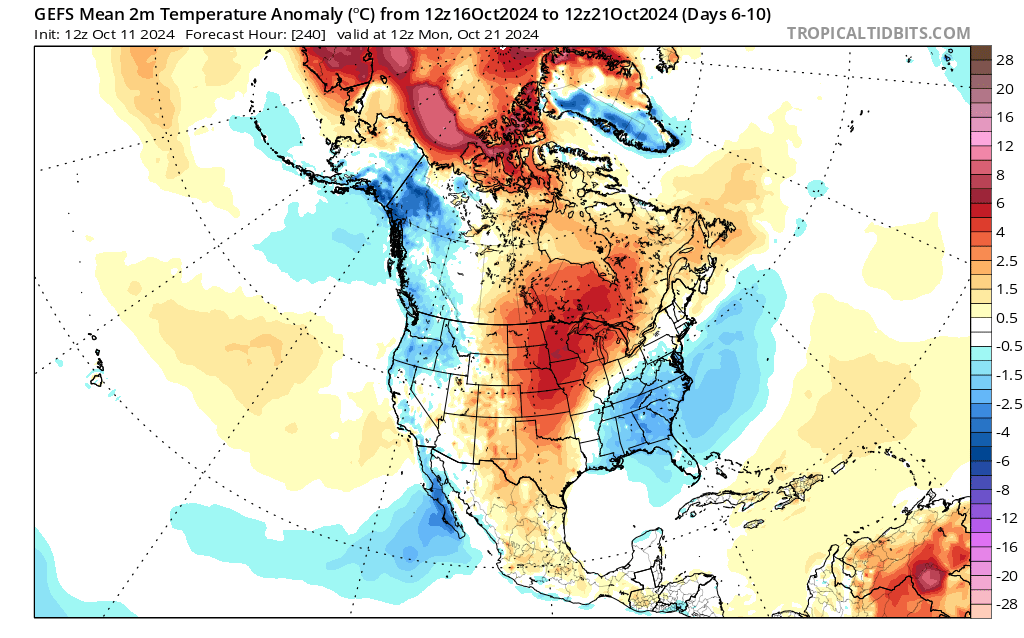
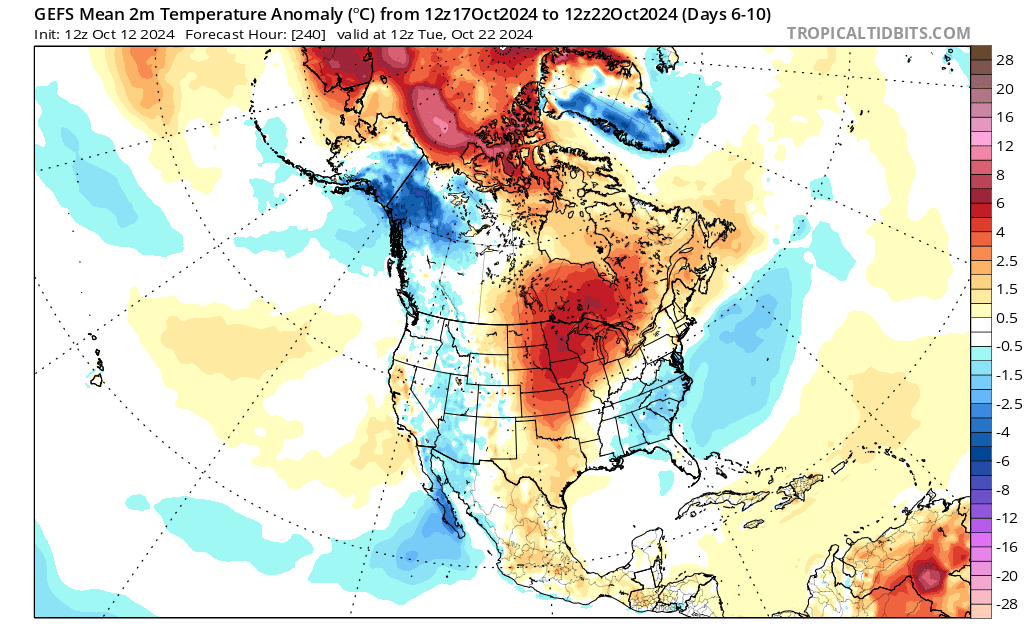
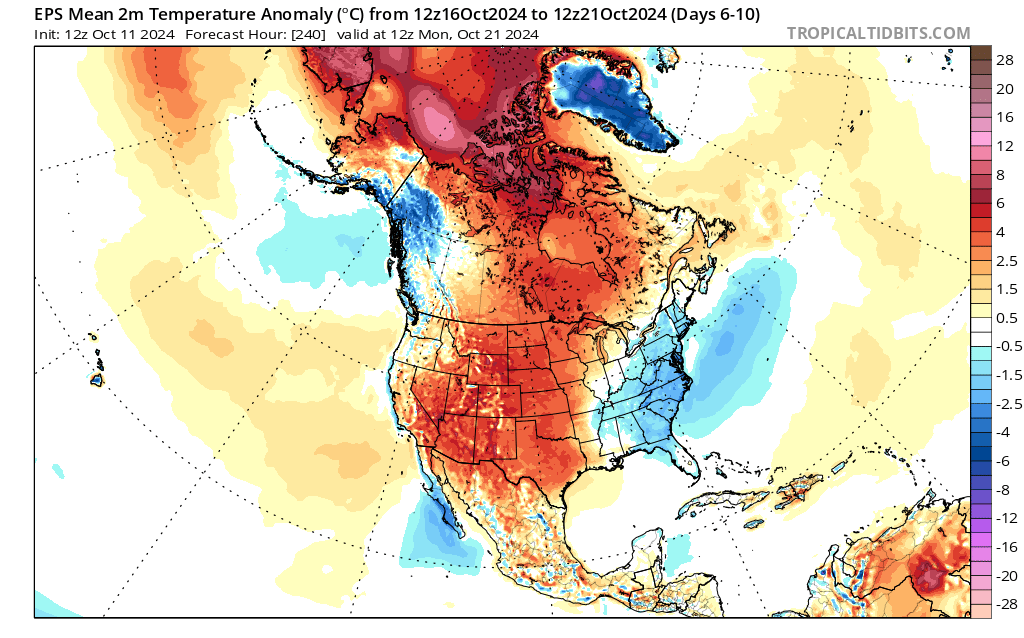
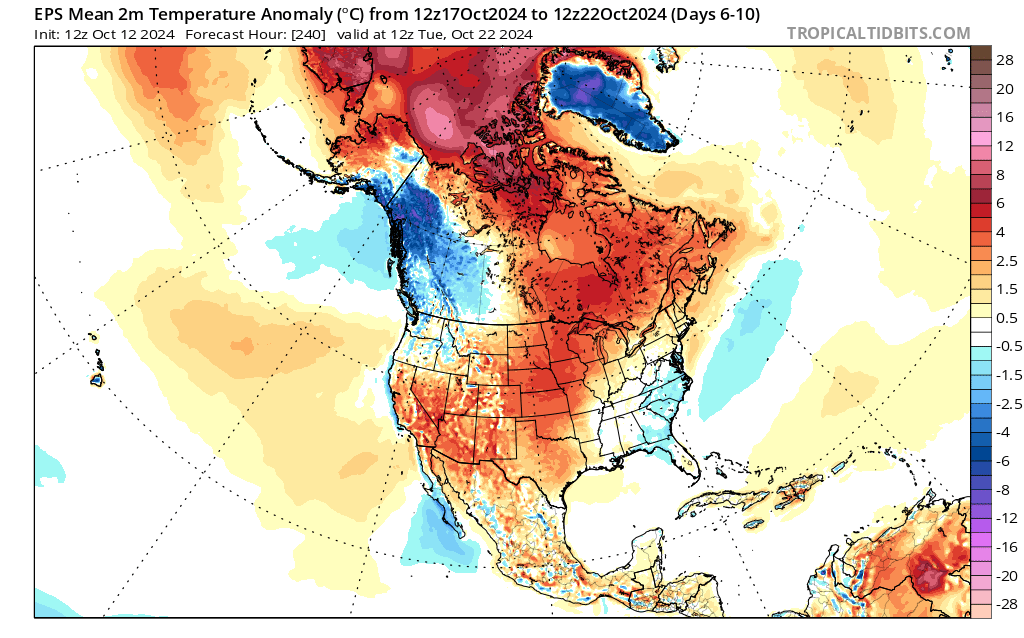
| 6 to 10 Day Model Ensemble Trend | ||
| Friday, October 18th through Wednesday, October 23rd | ||
| Surface Temperature Anomaly Plots | ||
 |
 |
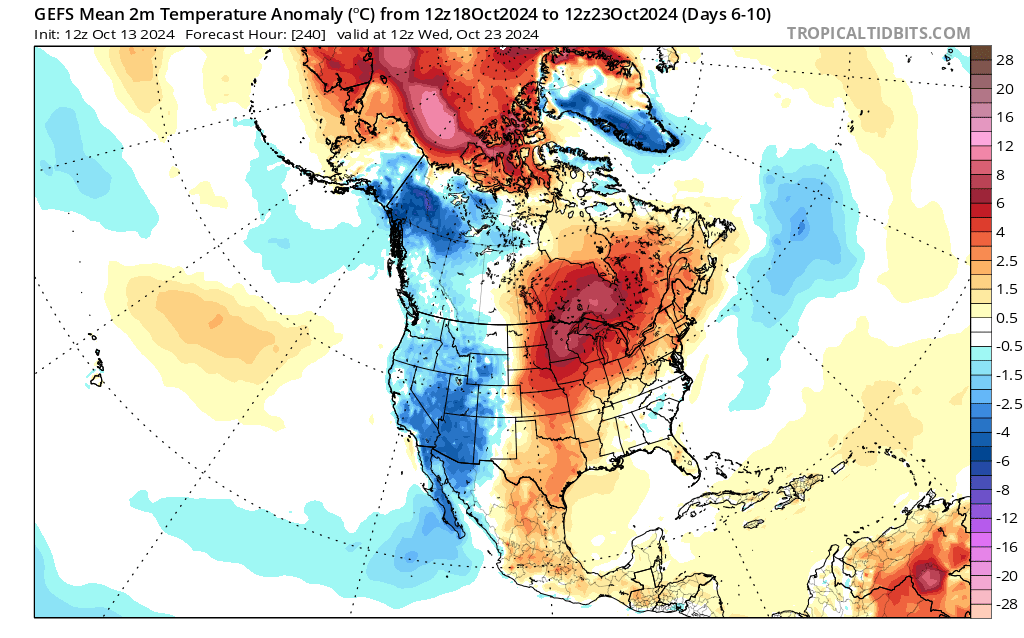 |
| GEFS -12z Fri, October 11th | GEFS – 12z Sat, October 12th | GEFS – 12z Sun, October 13th |
 |
 |
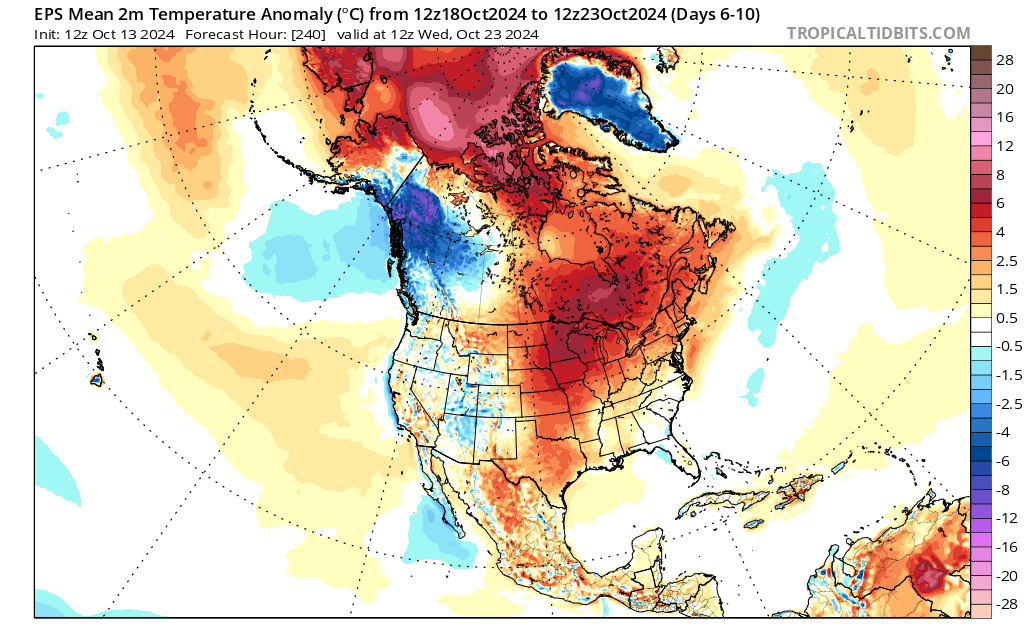 |
| EPS – 12z Fri, October 11th | EPS – 12z Sat, October 12th | EPS – 12z Sun, October 13th |
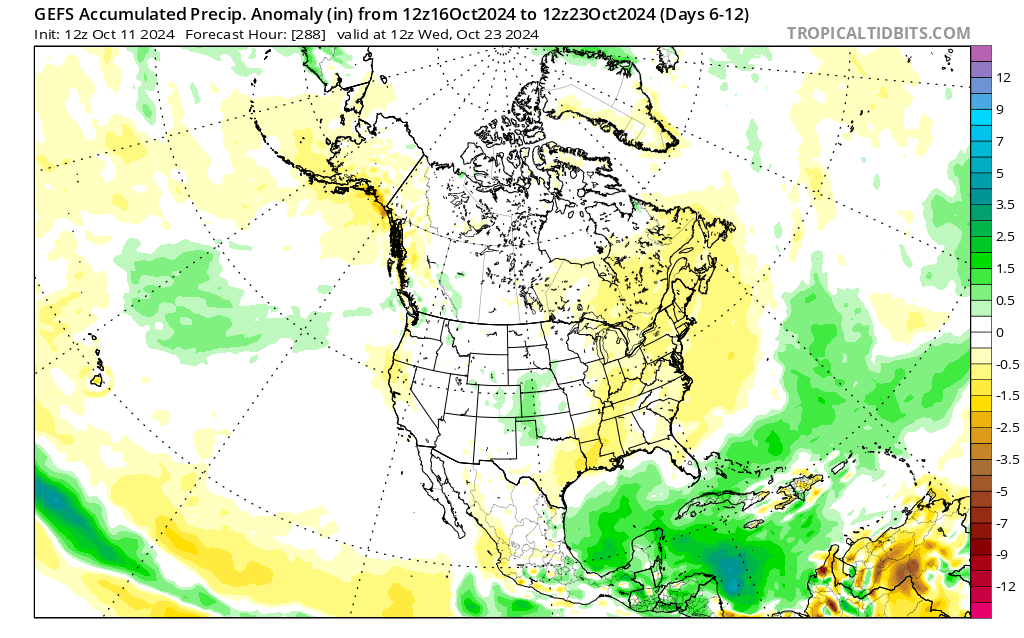
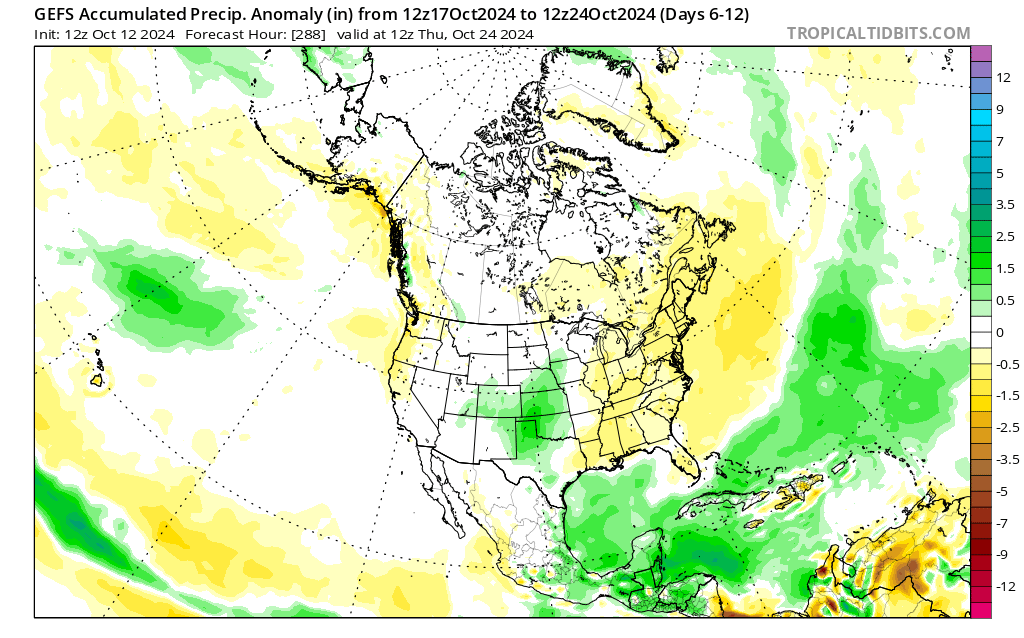
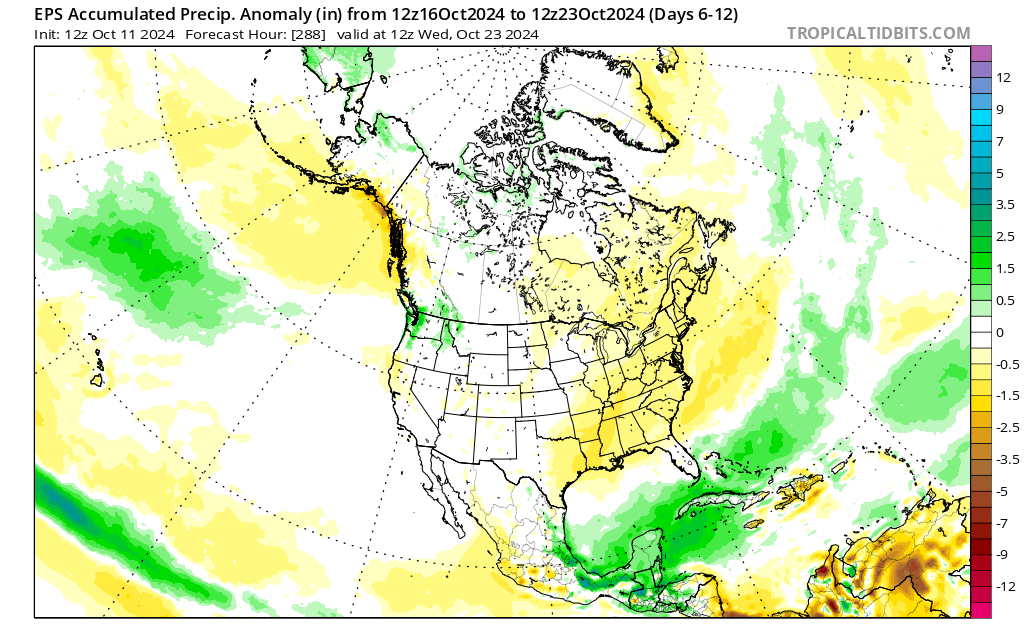
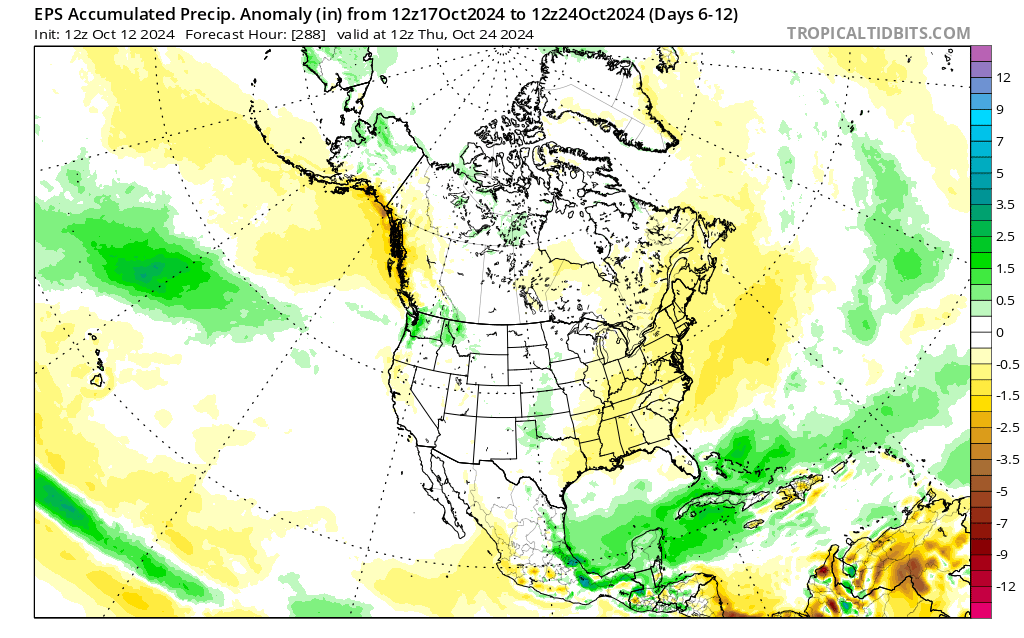
| 6 to 12 Day Model Ensemble Trend | ||
| Friday, October 18th through Friday, October 25th | ||
| Precipitation Anomaly Plots | ||
 |
 |
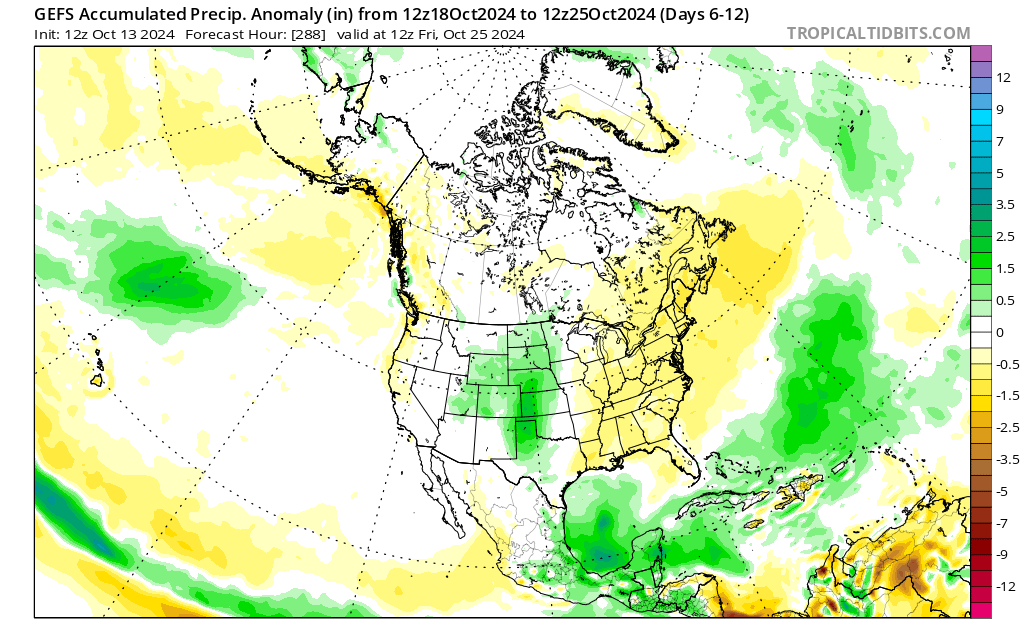 |
| GEFS – 12z Fri, October 11th | GEFS – 12z Sat, October 12th | GEFS – 12z Sun, October 13th |
 |
 |
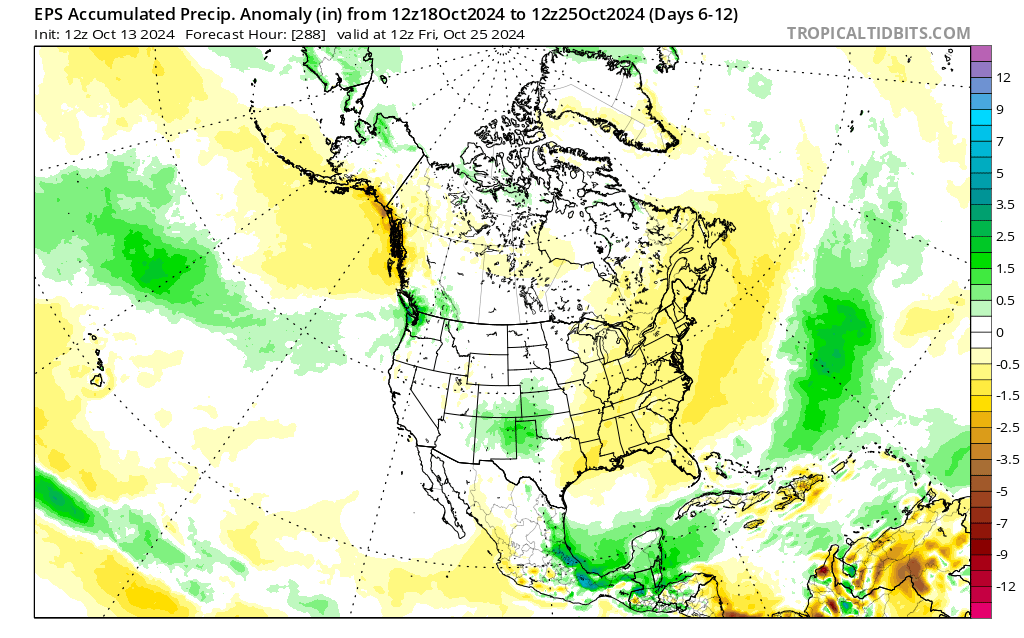 |
| EPS – 12z Fri, October 11th | EPS – 12z Sat, October 12th | EPS – 12z Sun, October 13th |
| 6 to 10 Day Climate Prediction Center Analog Forecast |
||
| Centered on Monday, October 21st | ||
| 500mb Anomaly Map | Temperature Outlook | Precipitation Outlook |
 |
 |
 |
| Click here to view the Top 10 Analog List |
||
| CIPS Historical Analog Guidance – Extended Range Guidance (168 to 312 Hours) |
||
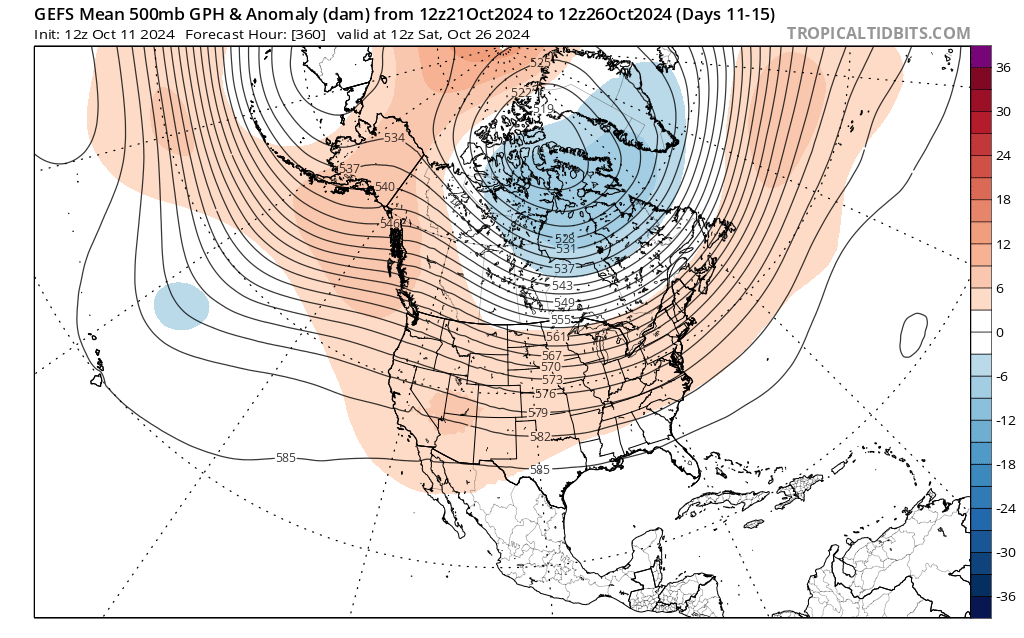
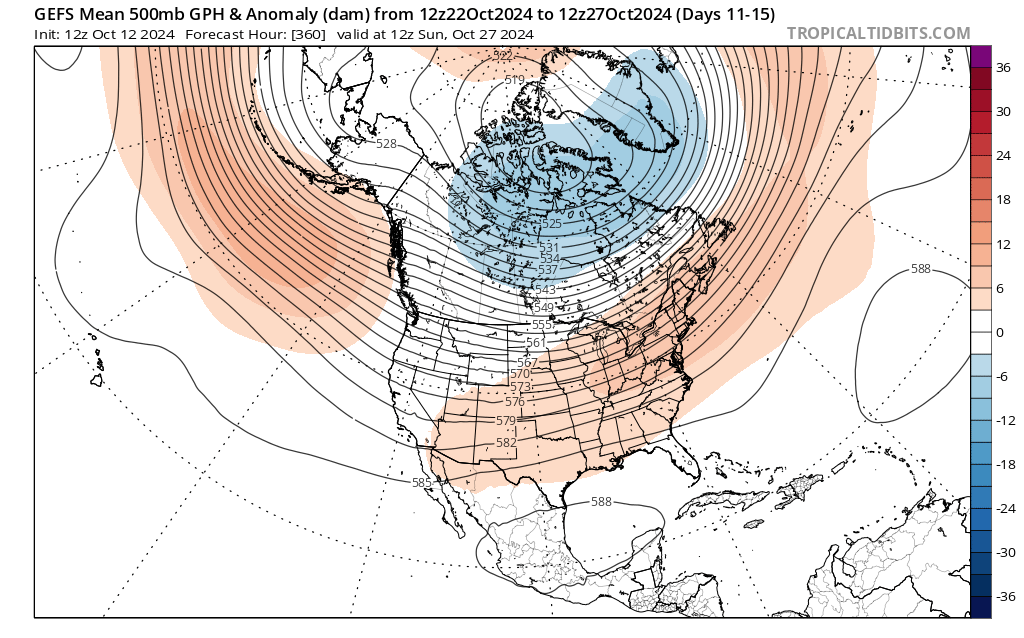
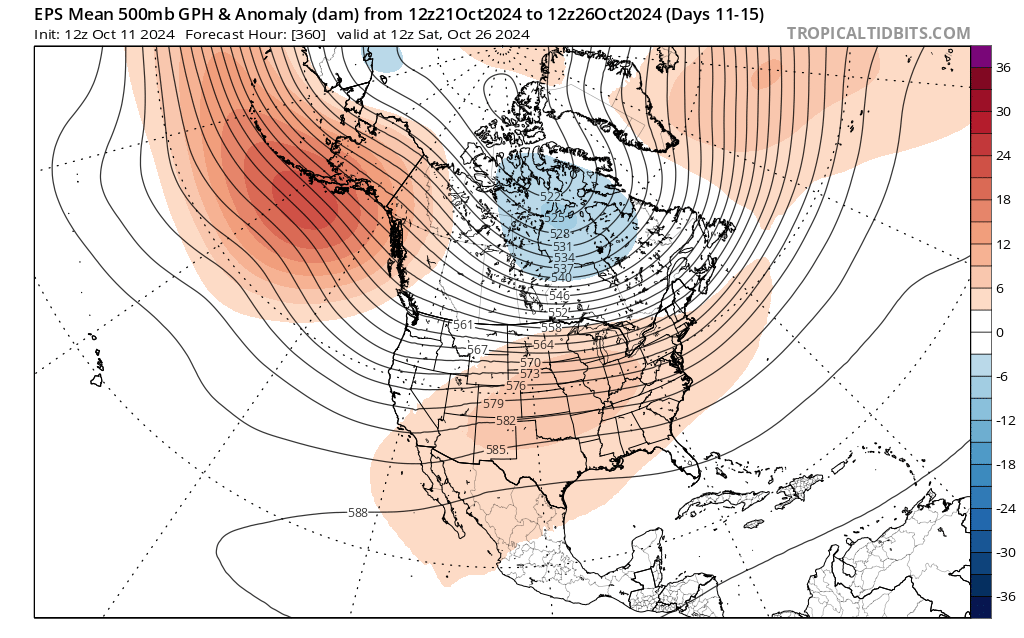
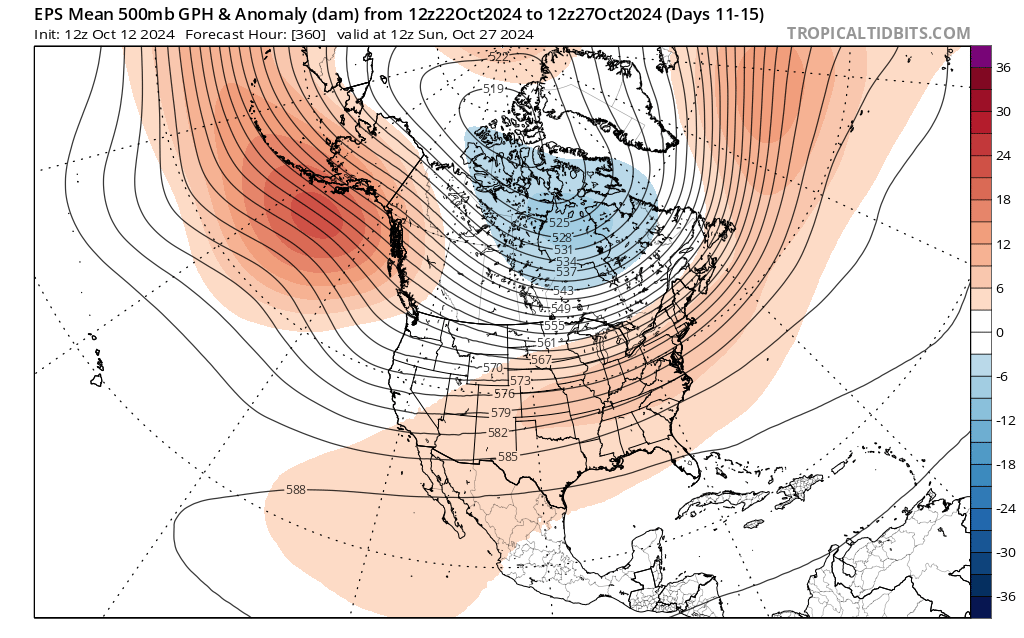
| 11 to 15 Day Model Ensemble Plots |
||
| Wednesday, October 23rd though Monday, October 28th | ||
| 500mb Height Anomaly Plots | ||
 |
 |
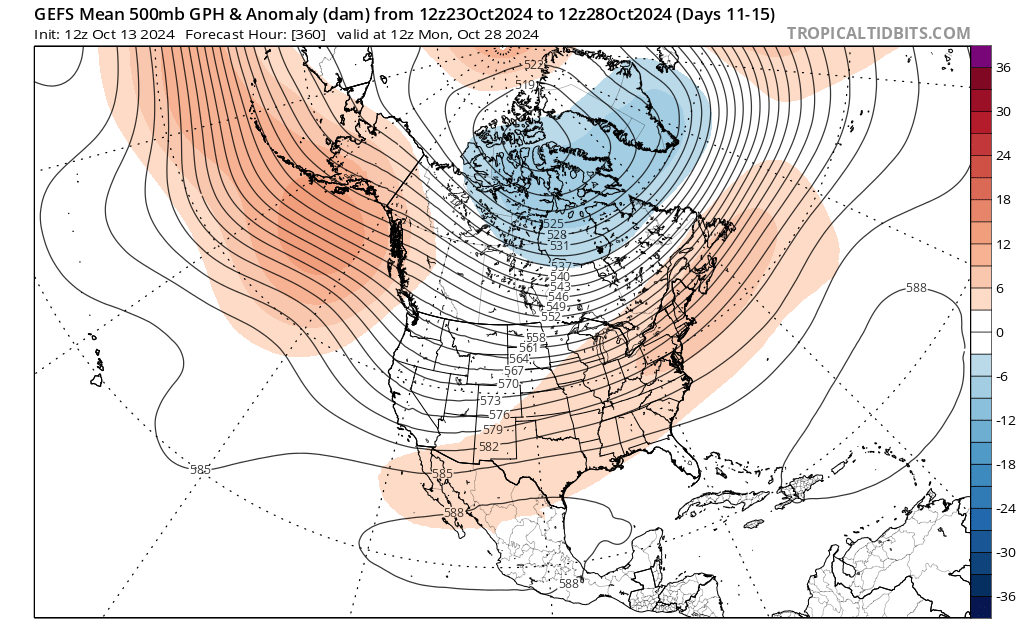 |
| GEFS – 12z Fri, October 11th | GEFS – 12z Sat, October 12th | GEFS – 12z Sun, October 13th |
 |
 |
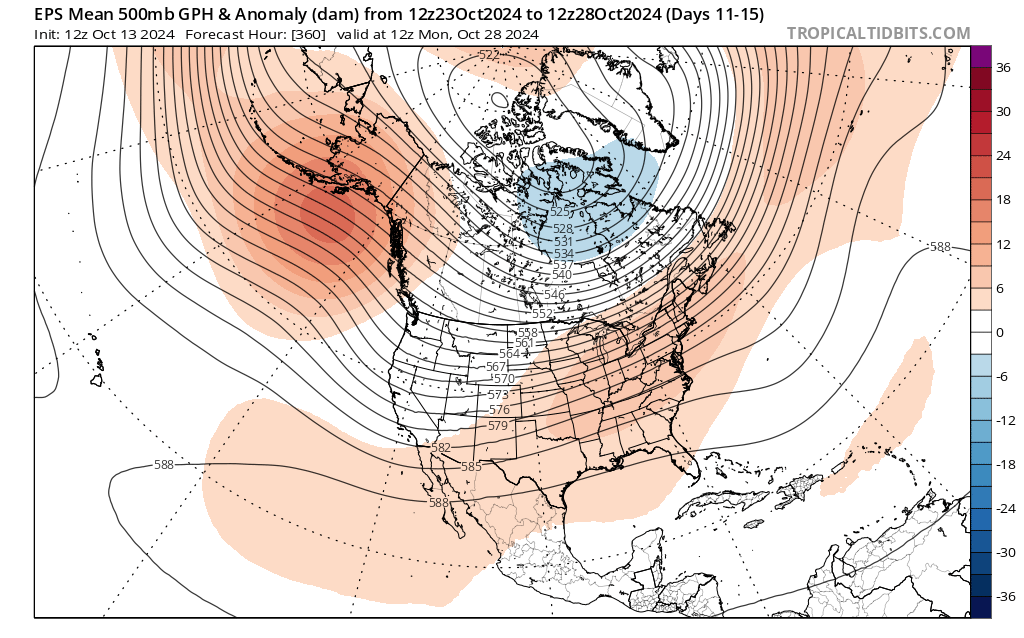 |
| EPS – 12z Fri, October 11th | EPS – 12z Sat, October 12th | EPS – 12z Sun, October 13th |
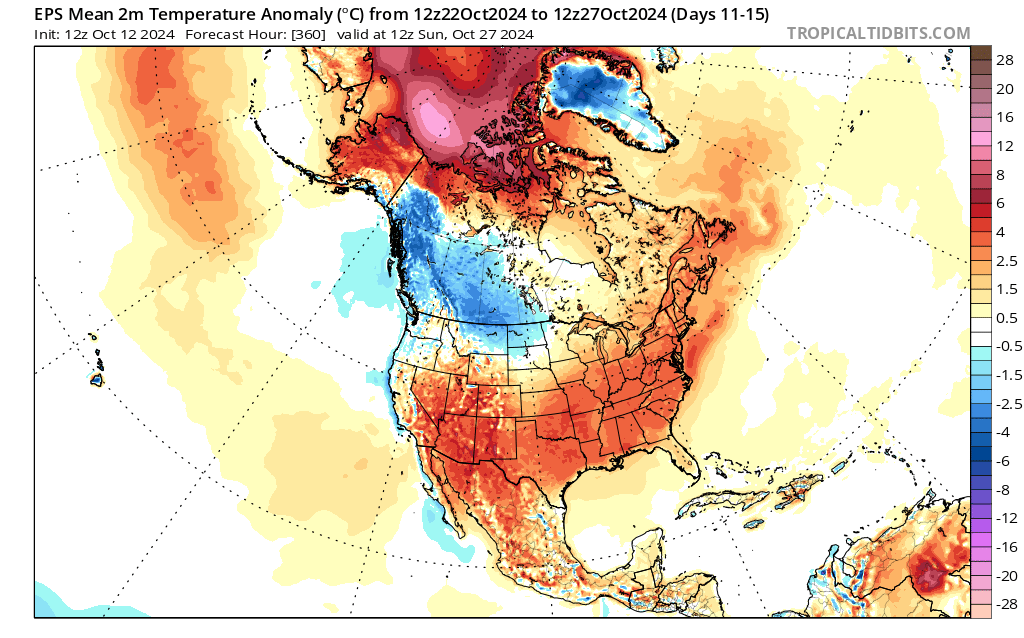
| 11 to 15 Day Model Ensemble Plots | ||
| Wednesday, October 23rd though Monday, October 28th | ||
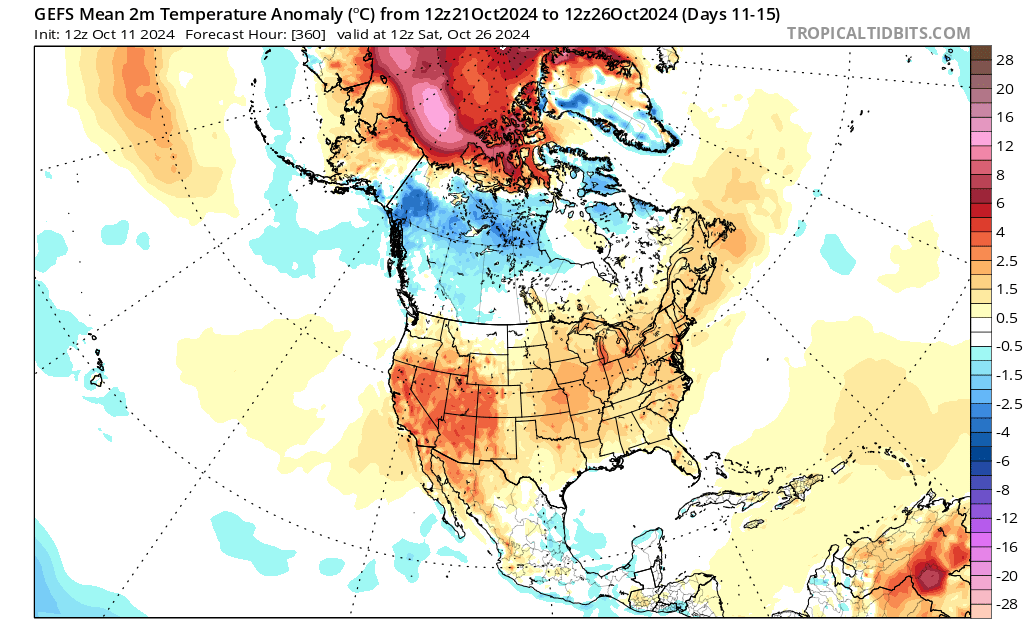
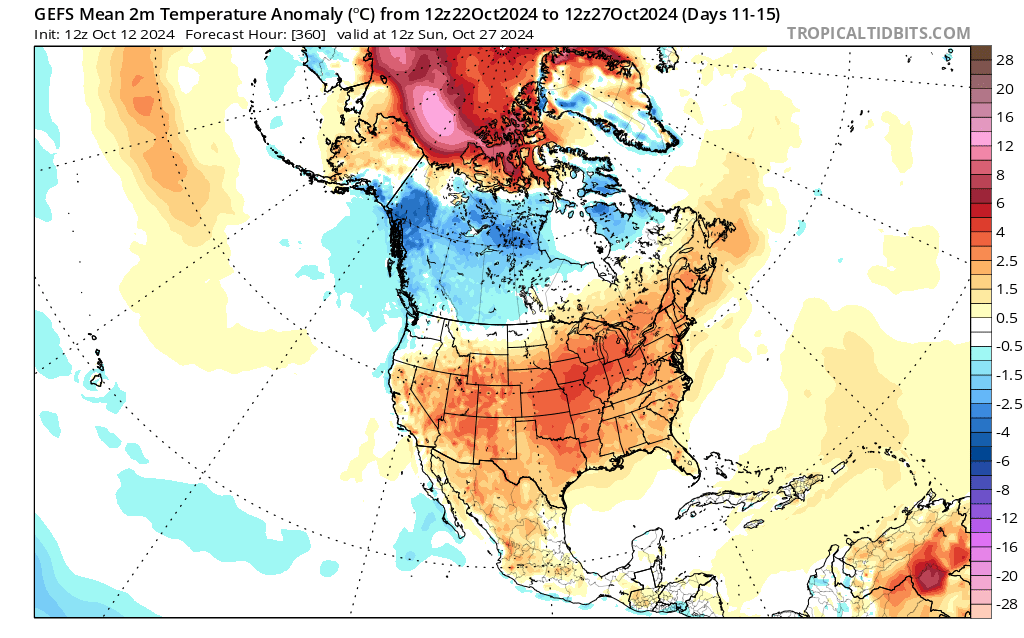
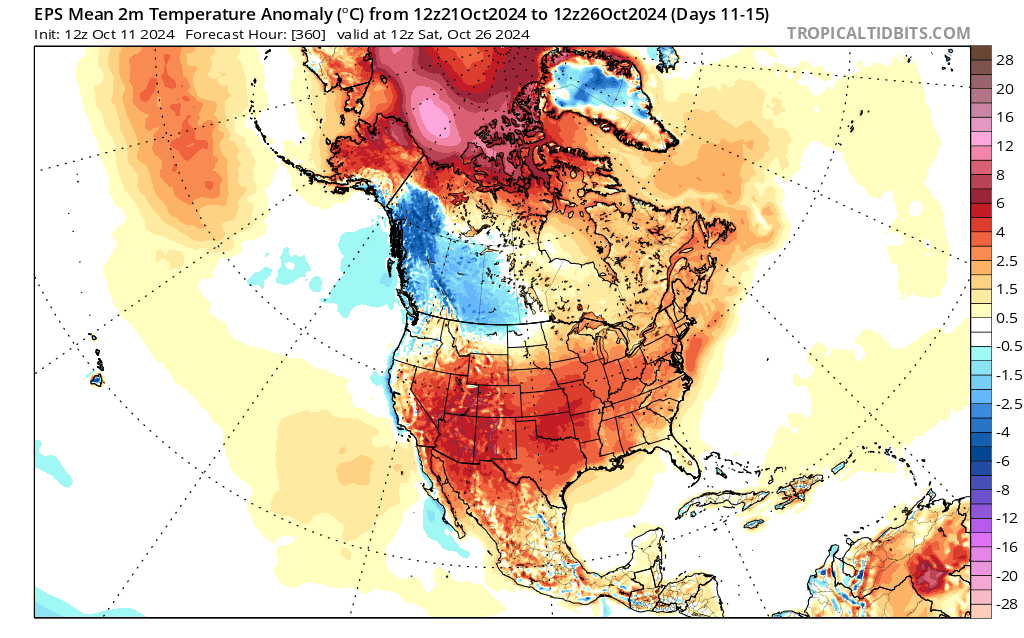
| Surface Temperature Anomaly Plots | ||
 |
 |
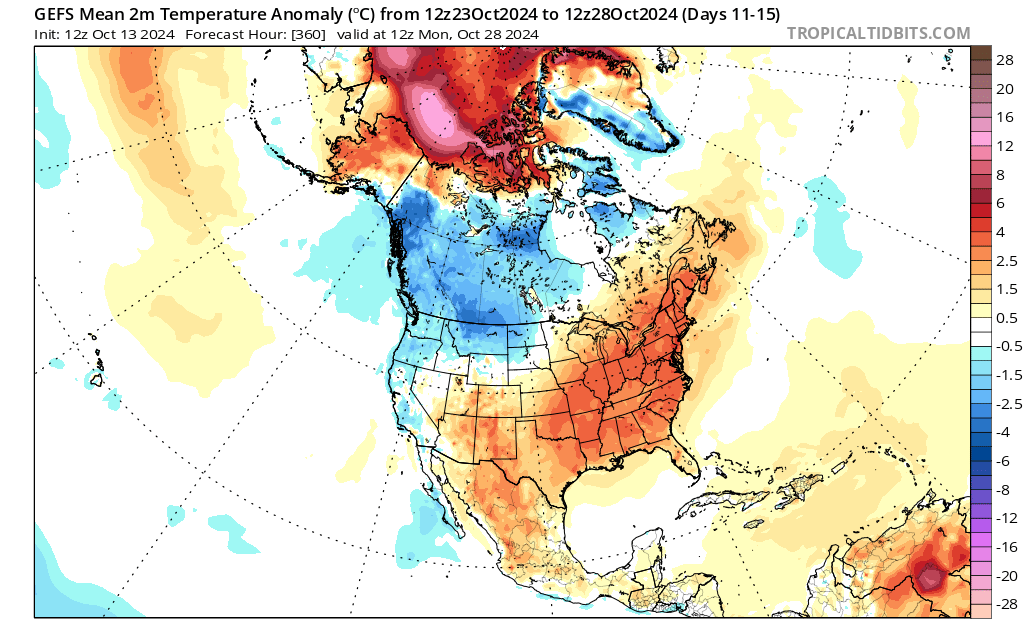 |
| GEFS – 12z Fri, October 11th | GEFS – 12z Sat, October 12th | GEFS – 12z Sun, October 13th |
 |
 |
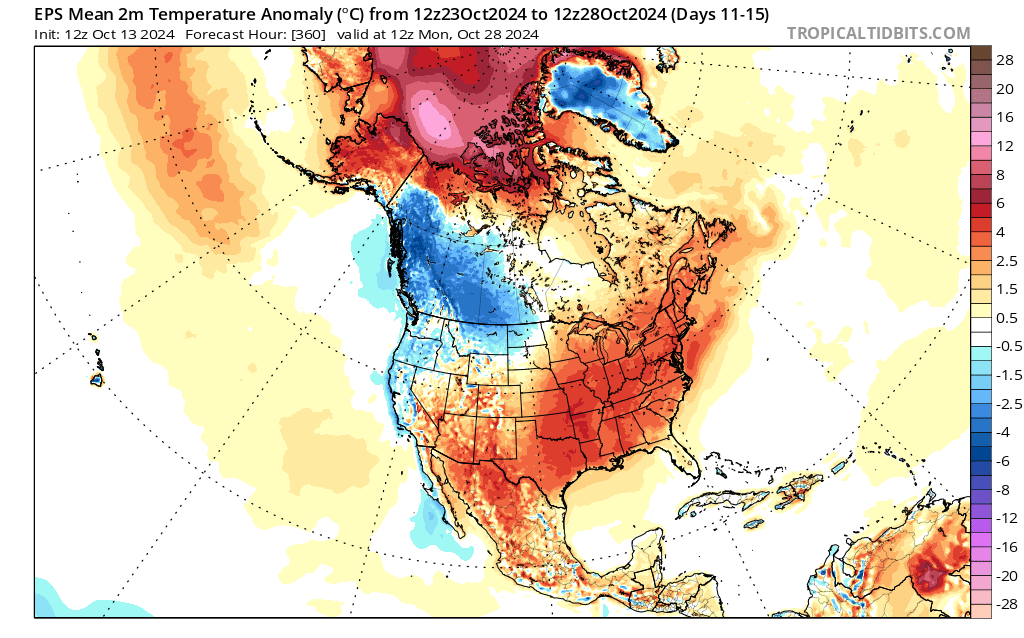 |
| EPS – 12z Fri, October 11th | EPS – 12z Sat, October 12th | EPS – 12z Sun, October 13th |
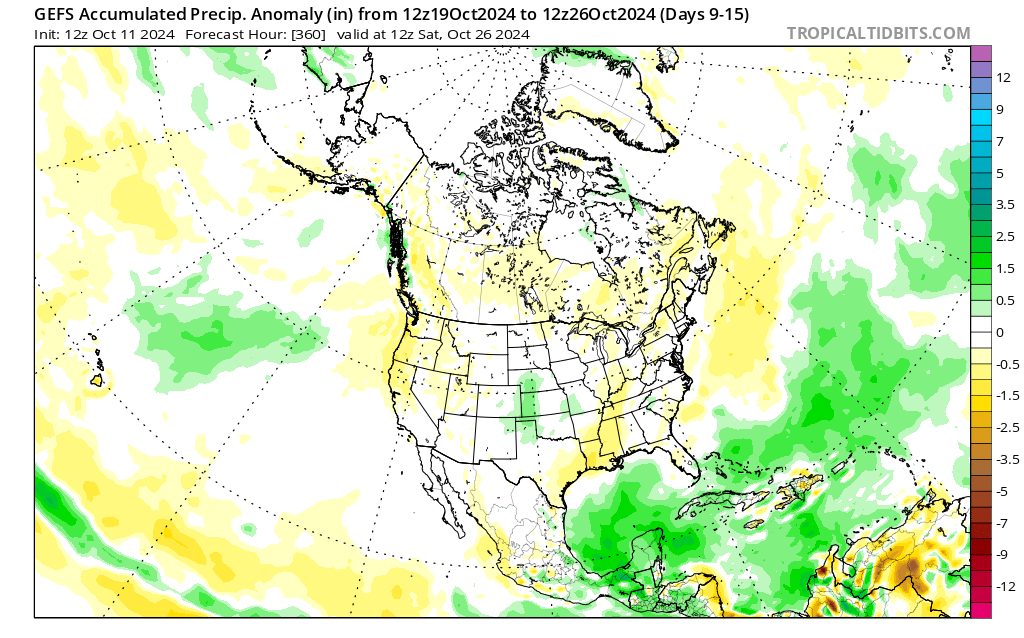
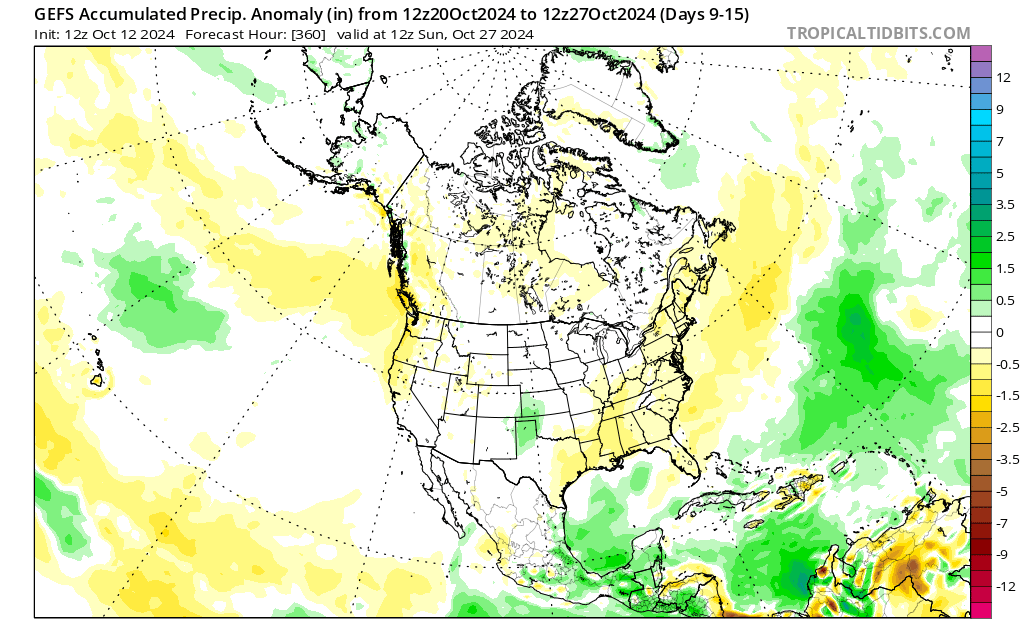
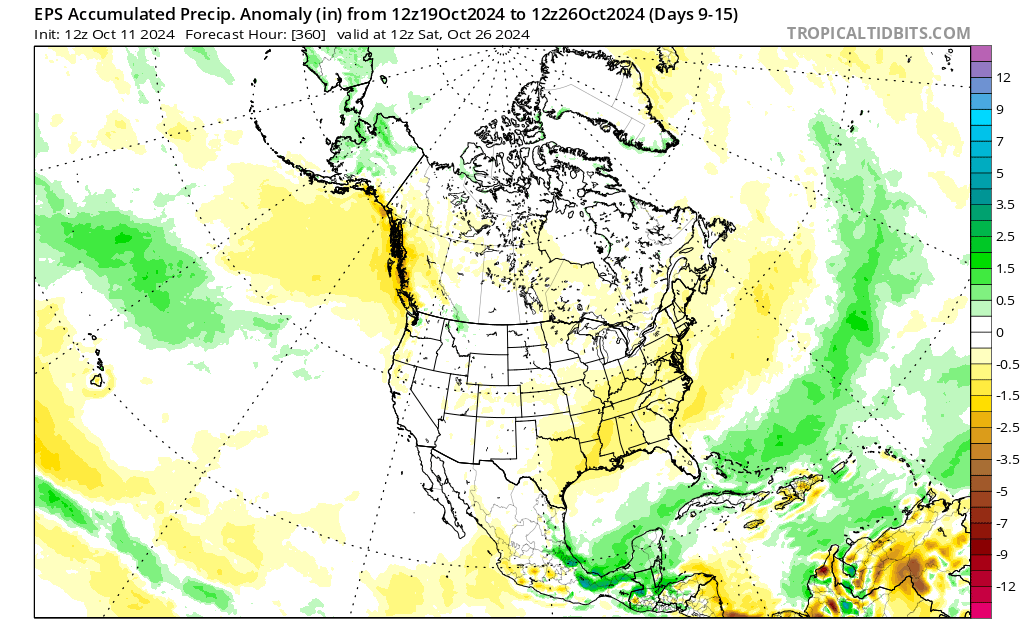
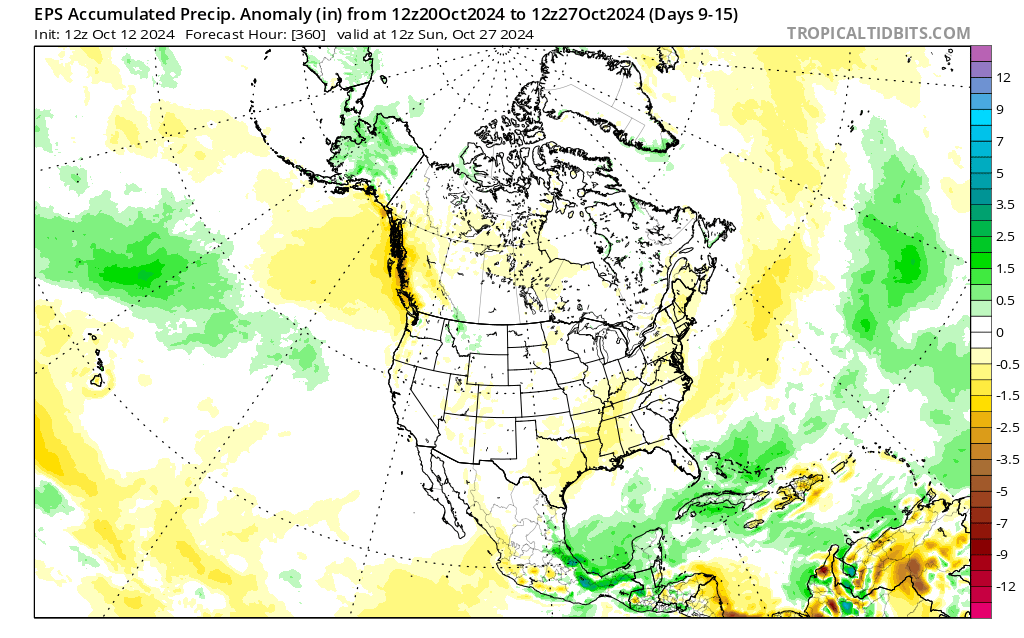
| 9 to 15 Day Model Ensemble Plots | ||
| Monday, October 21st though Monday, October 28th | ||
| Precipitation Anomaly Plots | ||
 |
 |
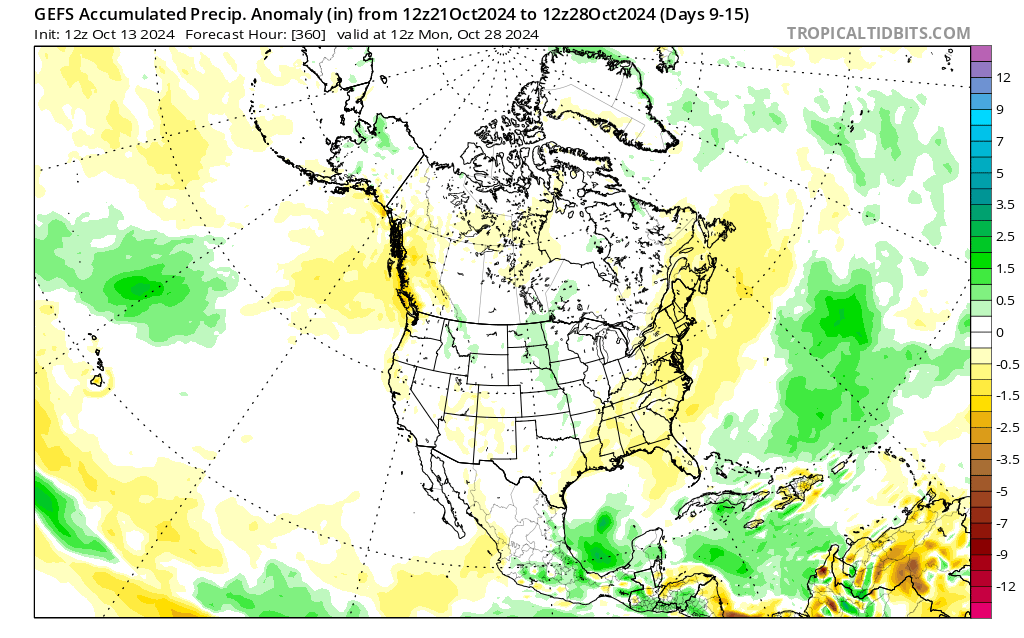 |
| GEFS – 12z Fri, October 11th | GEFS – 12z Sat, October 12th | GEFS – 12z Sun, October 13th |
 |
 |
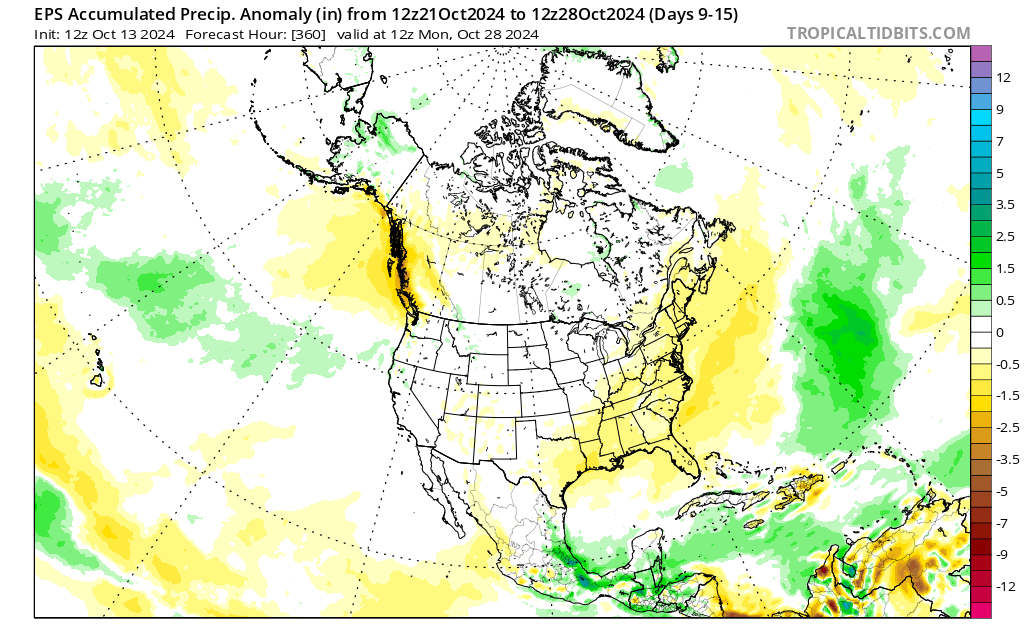 |
| EPS – 12z Fri, October 11th | EPS – 12z Sat, October 12th | EPS – 12z Sun, October 13th |
| 8 to 14 Day Climate Prediction Center Analog Forecast |
||
| Centered on Thursday, October 24th | ||
| 500mb Anomaly Map | Temperature Outlook | Precipitation Outlook |
 |
 |
 |
| Click here to view the Top 10 Analog List | ||
| CIPS Historical Analog Guidance – Extended Range Guidance (168 to 312 Hours) |
||
Background Information
|
||